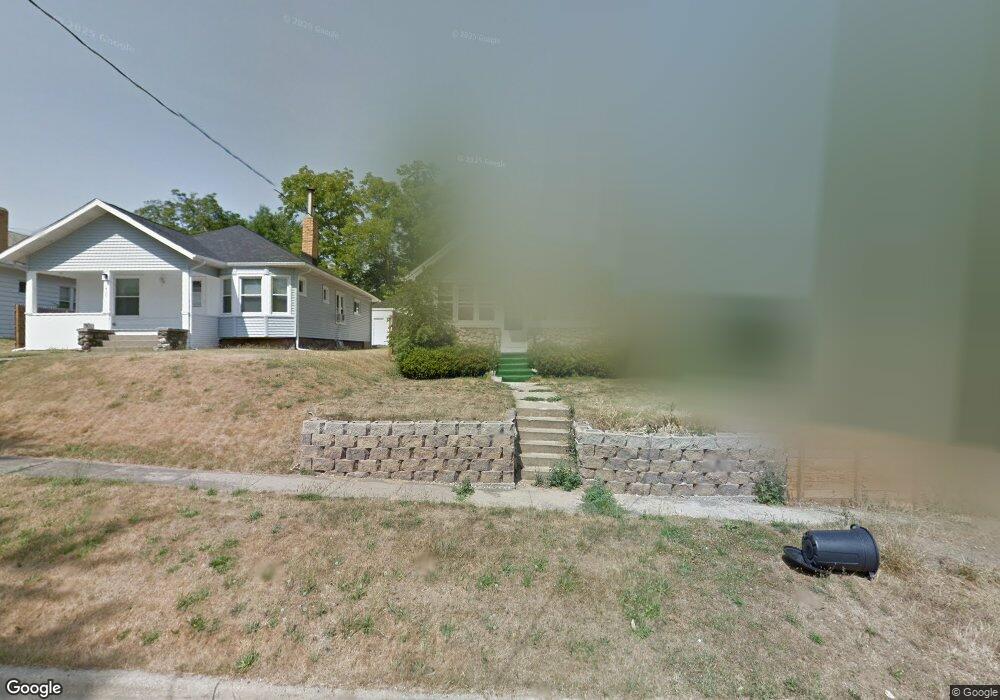
429 23rd St N Springfield, MI 49037
Estimated Value: $92,000 - $114,000
2
Beds
1
Bath
862
Sq Ft
$117/Sq Ft
Est. Value
About This Home
This home is located at 429 23rd St N, Springfield, MI 49037 and is currently estimated at $100,842, approximately $116 per square foot. 429 23rd St N is a home located in Calhoun County with nearby schools including Valley View Elementary School, Springfield Middle School, and Battle Creek Central High School.
Ownership History
Date
Name
Owned For
Owner Type
Purchase Details
Closed on
Oct 29, 2007
Sold by
Fannie Mae
Bought by
Johnson Raynard B
Current Estimated Value
Home Financials for this Owner
Home Financials are based on the most recent Mortgage that was taken out on this home.
Original Mortgage
$35,055
Outstanding Balance
$22,248
Interest Rate
6.44%
Mortgage Type
Purchase Money Mortgage
Estimated Equity
$78,594
Purchase Details
Closed on
Oct 24, 2006
Sold by
Mortgage Electronic Registration Systems
Bought by
Federal National Mortgage Association
Purchase Details
Closed on
Oct 13, 2006
Sold by
Rice Ryan
Bought by
Mortgage Electronic Registration Systems
Purchase Details
Closed on
Jul 18, 2003
Sold by
Vernia Virginia
Bought by
Rice Ryan
Create a Home Valuation Report for This Property
The Home Valuation Report is an in-depth analysis detailing your home's value as well as a comparison with similar homes in the area
Home Values in the Area
Average Home Value in this Area
Purchase History
| Date | Buyer | Sale Price | Title Company |
|---|---|---|---|
| Johnson Raynard B | $36,900 | Fidelity National Title | |
| Federal National Mortgage Association | -- | None Available | |
| Mortgage Electronic Registration Systems | $45,531 | None Available | |
| Rice Ryan | $55,000 | -- |
Source: Public Records
Mortgage History
| Date | Status | Borrower | Loan Amount |
|---|---|---|---|
| Open | Johnson Raynard B | $35,055 |
Source: Public Records
Tax History
| Year | Tax Paid | Tax Assessment Tax Assessment Total Assessment is a certain percentage of the fair market value that is determined by local assessors to be the total taxable value of land and additions on the property. | Land | Improvement |
|---|---|---|---|---|
| 2025 | $1,110 | $34,537 | $0 | $0 |
| 2024 | $745 | $34,568 | $0 | $0 |
| 2023 | $954 | $30,482 | $0 | $0 |
| 2022 | $675 | $26,192 | $0 | $0 |
| 2021 | $902 | $21,973 | $0 | $0 |
| 2020 | $890 | $18,471 | $0 | $0 |
| 2019 | $1,247 | $16,895 | $0 | $0 |
| 2018 | $0 | $16,173 | $3,218 | $12,955 |
| 2017 | $0 | $16,125 | $0 | $0 |
| 2016 | $0 | $14,972 | $0 | $0 |
| 2015 | -- | $12,940 | $0 | $0 |
| 2014 | -- | $15,880 | $0 | $0 |
Source: Public Records
Map
Nearby Homes
- 446 24th St N
- 431 22nd St N
- 430 21st St N
- 745 Upton Ave
- 690 Upton Ave
- 396 & 398 N 20th St
- 250 N 16th St
- 294 20th St N
- 50 Wellworth Ave
- V/L Lafayette Ave Unit 33
- V/L Lafayette Ave Unit 32
- V/L Lafayette Ave Unit 16
- V/L Lafayette Ave Unit 11
- 276 Lafayette Ave
- 248 23rd St N
- 254 Lafayette Ave
- 185 Kirkwood Ave
- 261 Parrish St
- 612 Hamblin Ave W
- 598 Hamblin Ave W
Your Personal Tour Guide
Ask me questions while you tour the home.