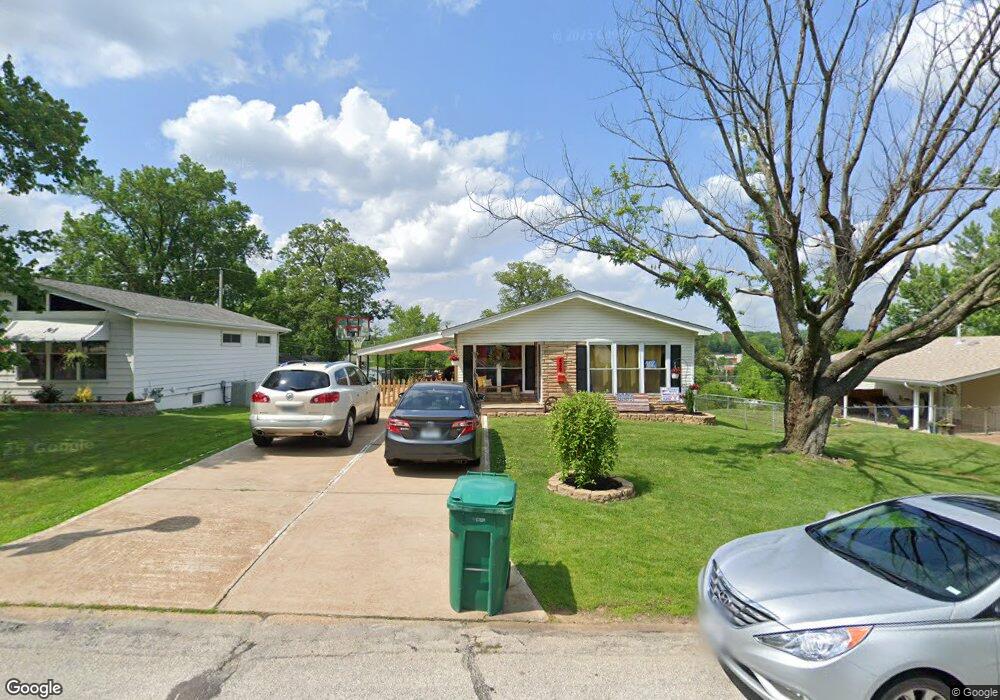
429 Ballwin Ave Ballwin, MO 63021
Estimated Value: $230,000 - $256,000
3
Beds
2
Baths
948
Sq Ft
$257/Sq Ft
Est. Value
About This Home
This home is located at 429 Ballwin Ave, Ballwin, MO 63021 and is currently estimated at $243,750, approximately $257 per square foot. 429 Ballwin Ave is a home located in St. Louis County with nearby schools including Sorrento Springs Elementary School, Parkway Southwest Middle School, and Parkway South High School.
Ownership History
Date
Name
Owned For
Owner Type
Purchase Details
Closed on
Oct 16, 2019
Sold by
Walker Joan Marie and Walker John P
Bought by
Spiroff Adam and Spiroff Aimee
Current Estimated Value
Purchase Details
Closed on
Feb 19, 2015
Sold by
Sodoma Michael J and Sodoma Priscilla A
Bought by
Walker Joan Marie and Walker John P
Purchase Details
Closed on
Apr 3, 2013
Sold by
Walker Joan Marie
Bought by
Walker Joan Marie and Walker John P
Purchase Details
Closed on
Aug 7, 2001
Sold by
Walker Joan Marie and Walker John P
Bought by
Walker John P and Walker Joan Marie
Purchase Details
Closed on
Aug 4, 2001
Sold by
Sodoma Michael John and Sodoma Priscilla A
Bought by
Sodoma Michael J and Sodoma Priscilla A
Purchase Details
Closed on
Aug 1, 2001
Sold by
Sodoma Jerome Roland and Sodoma Jane H
Bought by
Sodoma Jerome R and Sodoma Jane H
Purchase Details
Closed on
Sep 26, 1998
Sold by
Sodoma Dovie L
Bought by
Sodoma Michael John and Walker Joan Marie
Create a Home Valuation Report for This Property
The Home Valuation Report is an in-depth analysis detailing your home's value as well as a comparison with similar homes in the area
Home Values in the Area
Average Home Value in this Area
Purchase History
| Date | Buyer | Sale Price | Title Company |
|---|---|---|---|
| Spiroff Adam | -- | None Available | |
| Walker Joan Marie | -- | None Available | |
| Walker Joan Marie | -- | None Available | |
| Walker Joan Marie | -- | None Available | |
| Walker John P | -- | -- | |
| Sodoma Michael J | -- | -- | |
| Sodoma Jerome R | -- | -- | |
| Sodoma Michael John | -- | -- |
Source: Public Records
Tax History
| Year | Tax Paid | Tax Assessment Tax Assessment Total Assessment is a certain percentage of the fair market value that is determined by local assessors to be the total taxable value of land and additions on the property. | Land | Improvement |
|---|---|---|---|---|
| 2025 | $2,428 | $42,620 | $23,940 | $18,680 |
| 2024 | $2,428 | $36,790 | $17,960 | $18,830 |
| 2023 | $2,449 | $36,790 | $17,960 | $18,830 |
| 2022 | $2,259 | $31,110 | $17,960 | $13,150 |
| 2021 | $2,247 | $31,110 | $17,960 | $13,150 |
| 2020 | $1,905 | $25,180 | $14,520 | $10,660 |
| 2019 | $1,883 | $25,180 | $14,520 | $10,660 |
| 2018 | $2,100 | $25,980 | $11,650 | $14,330 |
| 2017 | $2,076 | $25,980 | $11,650 | $14,330 |
| 2016 | $1,812 | $21,470 | $9,750 | $11,720 |
| 2015 | $1,894 | $21,470 | $9,750 | $11,720 |
| 2014 | $1,737 | $21,910 | $6,670 | $15,240 |
Source: Public Records
Map
Nearby Homes
- 312 Ballwin Ave
- 401 Hillcrest Blvd
- 408 Saint Lawrence Dr
- 313 Saint Lawrence Dr
- 212 Lakeside Dr
- 3 Chappel Ct
- 0 Unknown Unit MIS25060078
- 0 Unknown Unit MIS25060104
- 0 Unknown Unit MIS25060076
- 0 Unknown Unit MIS25060105
- 0 Unknown Unit MIS25060100
- 0 Unknown Unit MIS25060079
- 0 Unknown Unit MIS25060108
- 0 Unknown Unit MIS25060103
- 0 Unknown Unit MIS25060077
- 604 Nandale Ln
- 429 Fairview Ct
- 729 Tuscan Valley Ct
- 804 Joyceann Dr
- 756 Alexander Mark Way
- 433 Ballwin Ave
- 425 Ballwin Ave
- 421 Ballwin Ave
- 437 Ballwin Ave
- 428 Lakeside Dr
- 424 Lakeside Dr
- 420 Lakeside Dr
- 417 Ballwin Ave
- 436 Ballwin Ave
- 440 Ballwin Ave
- 432 Ballwin Ave
- 225 Sulphur Spring Rd
- 428 Ballwin Ave
- 416 Lakeside Dr
- 229 Sulphur Spring Rd
- 413 Ballwin Ave
- 424 Ballwin Ave
- 412 Lakeside Dr
- 420 Ballwin Ave
- 233 Sulphur Spring Rd
Your Personal Tour Guide
Ask me questions while you tour the home.