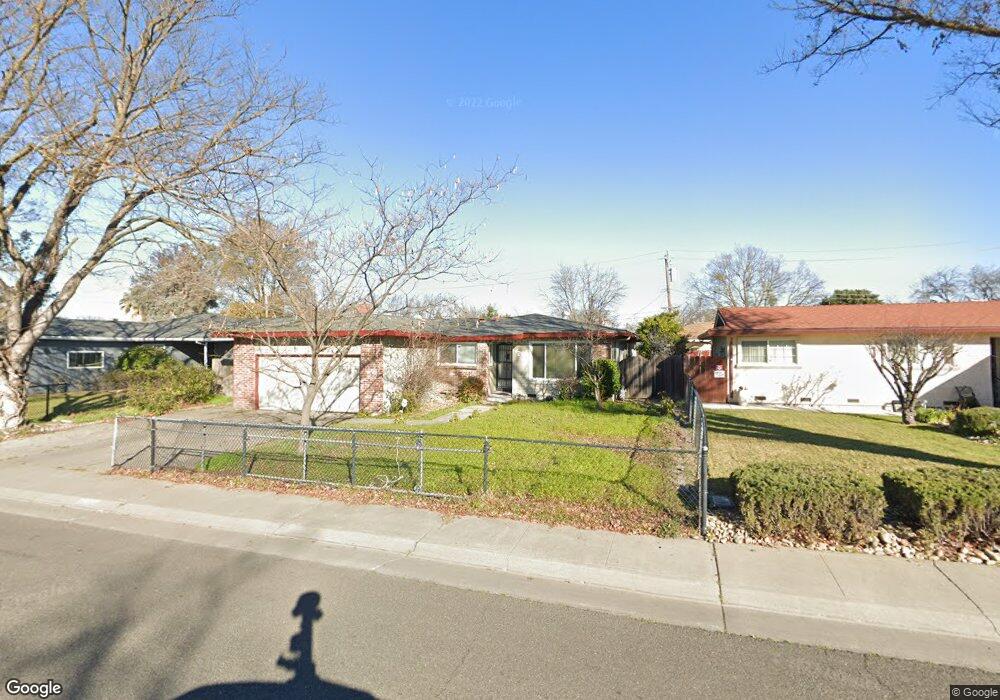
429 Cordova Ln Stockton, CA 95207
Lincoln Village NeighborhoodEstimated Value: $227,000 - $438,000
3
Beds
2
Baths
1,487
Sq Ft
$253/Sq Ft
Est. Value
About This Home
This home is located at 429 Cordova Ln, Stockton, CA 95207 and is currently estimated at $376,878, approximately $253 per square foot. 429 Cordova Ln is a home located in San Joaquin County with nearby schools including Pulliam Elementary School, Maxine Hong Kingston Elementary School, and Adams Elementary School.
Ownership History
Date
Name
Owned For
Owner Type
Purchase Details
Closed on
Nov 29, 2000
Sold by
Fisher Jonathan J and Fisher Lori A
Bought by
Eldabaany Mohamed A
Current Estimated Value
Home Financials for this Owner
Home Financials are based on the most recent Mortgage that was taken out on this home.
Original Mortgage
$123,824
Outstanding Balance
$45,499
Interest Rate
7.66%
Estimated Equity
$331,379
Purchase Details
Closed on
Sep 24, 1998
Sold by
Wilshire Servicing Fbo Sbrc Corp
Bought by
Fisher Jonathan J and Fisher Lori A
Home Financials for this Owner
Home Financials are based on the most recent Mortgage that was taken out on this home.
Original Mortgage
$55,000
Interest Rate
6.88%
Purchase Details
Closed on
Aug 20, 1997
Sold by
Geary Christopher J and Geary Roxane M
Bought by
Wilshire Servicing and Sbrc Corp
Create a Home Valuation Report for This Property
The Home Valuation Report is an in-depth analysis detailing your home's value as well as a comparison with similar homes in the area
Home Values in the Area
Average Home Value in this Area
Purchase History
| Date | Buyer | Sale Price | Title Company |
|---|---|---|---|
| Eldabaany Mohamed A | $124,000 | Old Republic Title Company | |
| Fisher Jonathan J | $55,000 | Fidelity National Title Co | |
| Wilshire Servicing | $52,500 | Chicago Title Co |
Source: Public Records
Mortgage History
| Date | Status | Borrower | Loan Amount |
|---|---|---|---|
| Open | Eldabaany Mohamed A | $123,824 | |
| Previous Owner | Fisher Jonathan J | $55,000 | |
| Closed | Eldabaany Mohamed A | $7,440 |
Source: Public Records
Tax History Compared to Growth
Tax History
| Year | Tax Paid | Tax Assessment Tax Assessment Total Assessment is a certain percentage of the fair market value that is determined by local assessors to be the total taxable value of land and additions on the property. | Land | Improvement |
|---|---|---|---|---|
| 2025 | $2,252 | $186,832 | $37,665 | $149,167 |
| 2024 | $2,214 | $183,170 | $36,927 | $146,243 |
| 2023 | $2,163 | $179,579 | $36,203 | $143,376 |
| 2022 | $2,117 | $176,059 | $35,494 | $140,565 |
| 2021 | $2,033 | $172,608 | $34,799 | $137,809 |
| 2020 | $2,071 | $170,839 | $34,443 | $136,396 |
| 2019 | $2,061 | $167,490 | $33,768 | $133,722 |
| 2018 | $2,021 | $164,206 | $33,106 | $131,100 |
| 2017 | $1,913 | $160,987 | $32,457 | $128,530 |
| 2016 | $1,947 | $157,831 | $31,821 | $126,010 |
| 2014 | $1,782 | $147,000 | $44,000 | $103,000 |
Source: Public Records
Map
Nearby Homes
- 602 Cordova Ln
- 7025 Kermit Ln
- 6703 Kermit Ln
- 731 Loretta Ct
- 436 Morro Ln
- 210 Cordova Ln
- 103 Cordova Ln
- 7 W Loretta Ave
- 6510 N El Dorado St
- 6905 N El Dorado St
- 308 Pomona Ave
- 7015 N El Dorado St
- 36 Lynda Ave
- 20 W La Mesa Ave
- 8024 Albany Dr
- 352 Jill Cir
- 801 Astor St
- 6706 Tam o Shanter Dr Unit 34
- 6706 Tam o Shanter Dr Unit 45
- 6706 Tam O'Shanter Dr Unit 112
- 437 Cordova Ln
- 421 Cordova Ln
- 456 Esperanza Way
- 462 Esperanza Way
- 501 Cordova Ln
- 450 Esperanza Way
- 413 Cordova Ln
- 434 Cordova Ln
- 426 Cordova Ln
- 444 Esperanza Way
- 468 Esperanza Way
- 418 Cordova Ln
- 405 Cordova Ln
- 509 Cordova Ln
- 438 Esperanza Way
- 412 Cordova Ln
- 506 Cordova Ln
- 7002 Hemet Ave
- 383 Cordova Ln
- 459 Esperanza Way