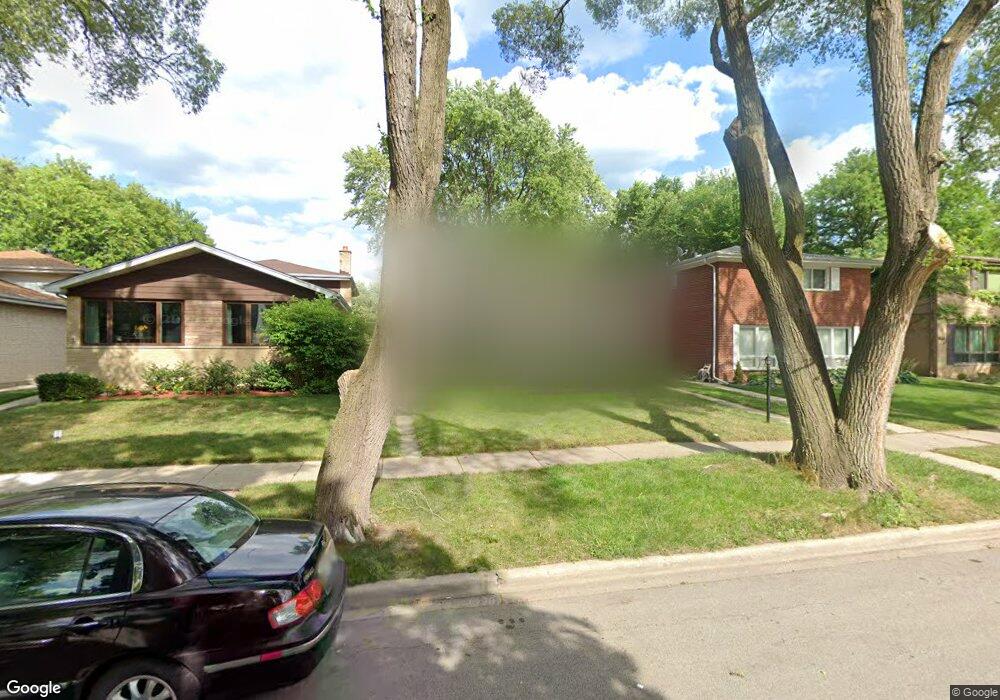
429 Dewey Ave Evanston, IL 60202
Southwest Evanston NeighborhoodEstimated Value: $555,024 - $614,000
3
Beds
2
Baths
1,404
Sq Ft
$421/Sq Ft
Est. Value
About This Home
This home is located at 429 Dewey Ave, Evanston, IL 60202 and is currently estimated at $591,006, approximately $420 per square foot. 429 Dewey Ave is a home located in Cook County with nearby schools including Dawes Elementary School, Chute Middle School, and Evanston Township High School.
Ownership History
Date
Name
Owned For
Owner Type
Purchase Details
Closed on
Jun 6, 2023
Sold by
Carter-Weathers Linta D and Carter-Weathers Jerry
Bought by
Linta D Carter-Weathers Living Trust and Carter-Weathers
Current Estimated Value
Purchase Details
Closed on
Jan 26, 2015
Sold by
Carter Linta
Bought by
Carter Weathers Linta D and Weathers Jerry
Home Financials for this Owner
Home Financials are based on the most recent Mortgage that was taken out on this home.
Original Mortgage
$352,000
Interest Rate
4.25%
Mortgage Type
New Conventional
Purchase Details
Closed on
Jan 30, 2009
Sold by
Kossy Irving and Kossy Joyce
Bought by
Carter Linda
Home Financials for this Owner
Home Financials are based on the most recent Mortgage that was taken out on this home.
Original Mortgage
$353,479
Interest Rate
5.06%
Mortgage Type
FHA
Purchase Details
Closed on
Feb 6, 2001
Sold by
Kossy Irving and Kossy Joyce
Bought by
Kossy Irving and Kossy Joyce
Create a Home Valuation Report for This Property
The Home Valuation Report is an in-depth analysis detailing your home's value as well as a comparison with similar homes in the area
Home Values in the Area
Average Home Value in this Area
Purchase History
| Date | Buyer | Sale Price | Title Company |
|---|---|---|---|
| Linta D Carter-Weathers Living Trust | -- | None Listed On Document | |
| Carter Weathers Linta D | -- | Fidelity National Title | |
| Carter Linda | $360,000 | None Available | |
| Kossy Irving | -- | -- |
Source: Public Records
Mortgage History
| Date | Status | Borrower | Loan Amount |
|---|---|---|---|
| Previous Owner | Carter Weathers Linta D | $352,000 | |
| Previous Owner | Carter Linda | $353,479 |
Source: Public Records
Tax History
| Year | Tax Paid | Tax Assessment Tax Assessment Total Assessment is a certain percentage of the fair market value that is determined by local assessors to be the total taxable value of land and additions on the property. | Land | Improvement |
|---|---|---|---|---|
| 2025 | $9,968 | $49,000 | $13,416 | $35,584 |
| 2024 | $9,968 | $39,797 | $11,352 | $28,445 |
| 2023 | $9,537 | $43,952 | $11,352 | $32,600 |
| 2022 | $9,537 | $43,952 | $11,352 | $32,600 |
| 2021 | $7,914 | $32,756 | $8,256 | $24,500 |
| 2020 | $7,867 | $32,756 | $8,256 | $24,500 |
| 2019 | $8,461 | $39,074 | $8,256 | $30,818 |
| 2018 | $8,153 | $32,803 | $6,880 | $25,923 |
| 2017 | $8,629 | $35,297 | $6,880 | $28,417 |
| 2016 | $8,407 | $35,297 | $6,880 | $28,417 |
| 2015 | $6,904 | $28,011 | $5,676 | $22,335 |
| 2014 | $6,853 | $28,011 | $5,676 | $22,335 |
| 2013 | $6,678 | $28,011 | $5,676 | $22,335 |
Source: Public Records
Map
Nearby Homes
- 1800 Kirk St
- 1736 Keeney St
- 538 Wesley Ave
- 704 Florence Ave
- 1507 Cleveland St
- 1815 Cleveland St
- 1217 Hull Terrace Unit 3A
- 1412 Brummel St Unit 2E
- 1321 Brummel St
- 1517 Dobson St
- 1609 Howard St Unit 2
- 1104 Austin St
- 1520 Washington St
- 1810 Washington St
- 2507 W Howard St
- 2109 Dobson St
- SAN JUAN GRANDE La Cascabela
- 2124 Brummel St
- 439 Ridge Ave Unit 2
- 2123 Howard St Unit 1H
Your Personal Tour Guide
Ask me questions while you tour the home.