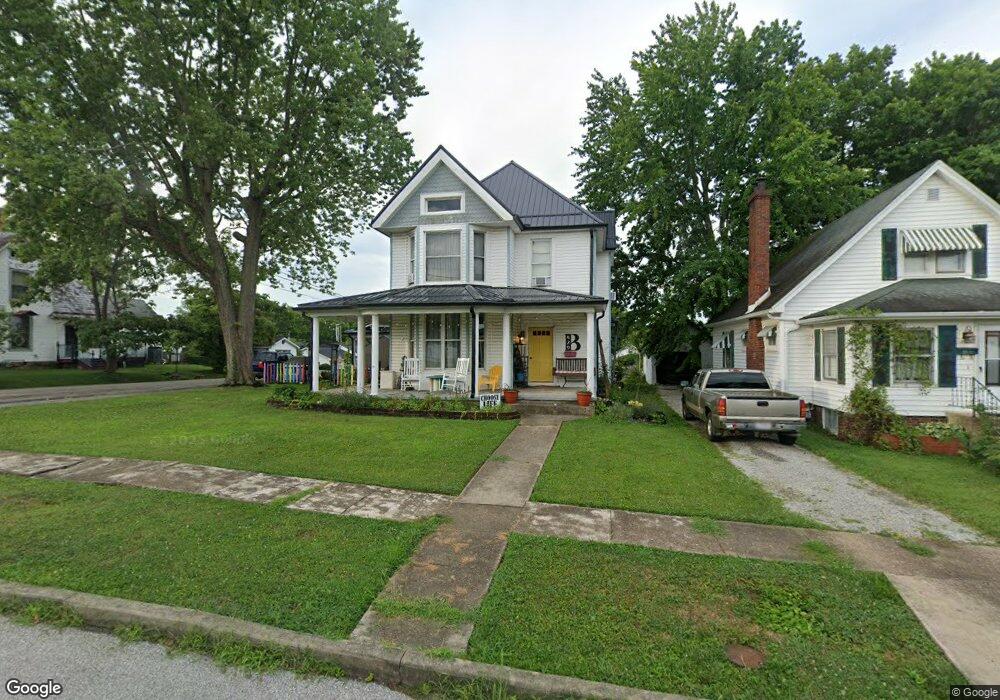
429 E Walnut St West Union, OH 45693
Estimated Value: $164,000 - $188,000
4
Beds
2
Baths
2,676
Sq Ft
$67/Sq Ft
Est. Value
About This Home
This home is located at 429 E Walnut St, West Union, OH 45693 and is currently estimated at $179,887, approximately $67 per square foot. 429 E Walnut St is a home located in Adams County with nearby schools including West Union Elementary School, West Union High School, and Adams County Christian School.
Ownership History
Date
Name
Owned For
Owner Type
Purchase Details
Closed on
Nov 19, 2021
Sold by
Buda Raymond J
Bought by
Buda Jason and Buda Melinda
Current Estimated Value
Home Financials for this Owner
Home Financials are based on the most recent Mortgage that was taken out on this home.
Original Mortgage
$75,000
Outstanding Balance
$68,144
Interest Rate
2.99%
Mortgage Type
New Conventional
Estimated Equity
$111,743
Purchase Details
Closed on
Aug 22, 2016
Sold by
Buda Janis and Buda Raymond J
Bought by
Buda Janis and Buda Raymond J
Purchase Details
Closed on
Sep 27, 2013
Sold by
Pearon Paul James
Bought by
Buda Janis
Home Financials for this Owner
Home Financials are based on the most recent Mortgage that was taken out on this home.
Original Mortgage
$67,500
Interest Rate
4.5%
Mortgage Type
Future Advance Clause Open End Mortgage
Purchase Details
Closed on
Jan 1, 1990
Bought by
Pearon Leola Mae Trustee
Create a Home Valuation Report for This Property
The Home Valuation Report is an in-depth analysis detailing your home's value as well as a comparison with similar homes in the area
Home Values in the Area
Average Home Value in this Area
Purchase History
| Date | Buyer | Sale Price | Title Company |
|---|---|---|---|
| Buda Jason | $110,000 | Technetitle | |
| Buda Janis | -- | None Available | |
| Buda Janis | $90,000 | None Available | |
| Pearon Leola Mae Trustee | -- | -- |
Source: Public Records
Mortgage History
| Date | Status | Borrower | Loan Amount |
|---|---|---|---|
| Open | Buda Jason | $75,000 | |
| Closed | Buda Janis | $67,500 |
Source: Public Records
Tax History
| Year | Tax Paid | Tax Assessment Tax Assessment Total Assessment is a certain percentage of the fair market value that is determined by local assessors to be the total taxable value of land and additions on the property. | Land | Improvement |
|---|---|---|---|---|
| 2025 | $1,582 | $42,220 | $3,610 | $38,610 |
| 2024 | $1,582 | $42,220 | $3,610 | $38,610 |
| 2023 | $1,527 | $42,220 | $3,610 | $38,610 |
| 2022 | $1,455 | $35,910 | $2,730 | $33,180 |
| 2021 | $1,405 | $35,910 | $2,730 | $33,180 |
| 2020 | $1,368 | $35,910 | $2,730 | $33,180 |
| 2019 | $1,368 | $35,910 | $2,730 | $33,180 |
| 2018 | $1,252 | $31,570 | $2,730 | $28,840 |
| 2017 | $1,233 | $31,570 | $2,730 | $28,840 |
| 2016 | $1,231 | $31,570 | $2,730 | $28,840 |
| 2015 | $915 | $24,190 | $2,730 | $21,460 |
| 2014 | $916 | $24,190 | $2,730 | $21,460 |
Source: Public Records
Map
Nearby Homes
- 104 N Washington St
- 537 1st St
- 601 E Main St
- 0.8ac State Route 41
- 12196 State Route 41
- 70 Logans Ln
- 819 E Main St
- 286 & 290 S Market St
- 305 W Walnut St
- 430 Poplar St
- 408 W South St
- 353 Chestnut Ridge Rd
- 9727 Ohio 125
- 215 Chesley St
- 216 Kurt St
- 917 Logans Ln
- 1478 Robinson Hollow Rd
- 40 Greenwood Ave
- 4400 Chapparal Rd
- 80 Madonna Dr
- 425 E Walnut St
- 503 E Walnut St
- 419 E Walnut St
- 507 E Walnut St
- 430 E Walnut St
- 422 E Walnut St
- 428 E South St
- 413 E Walnut St
- 120 S Washington St
- 420 E South St
- 416 E Walnut St
- 414 E Walnut St
- 427 E South St
- 117 N Washington St
- 508 E Walnut St
- 512 E Walnut St
- 412 E South St
- 515 E Walnut St
- 419 E South St
- 503 E South St
Your Personal Tour Guide
Ask me questions while you tour the home.