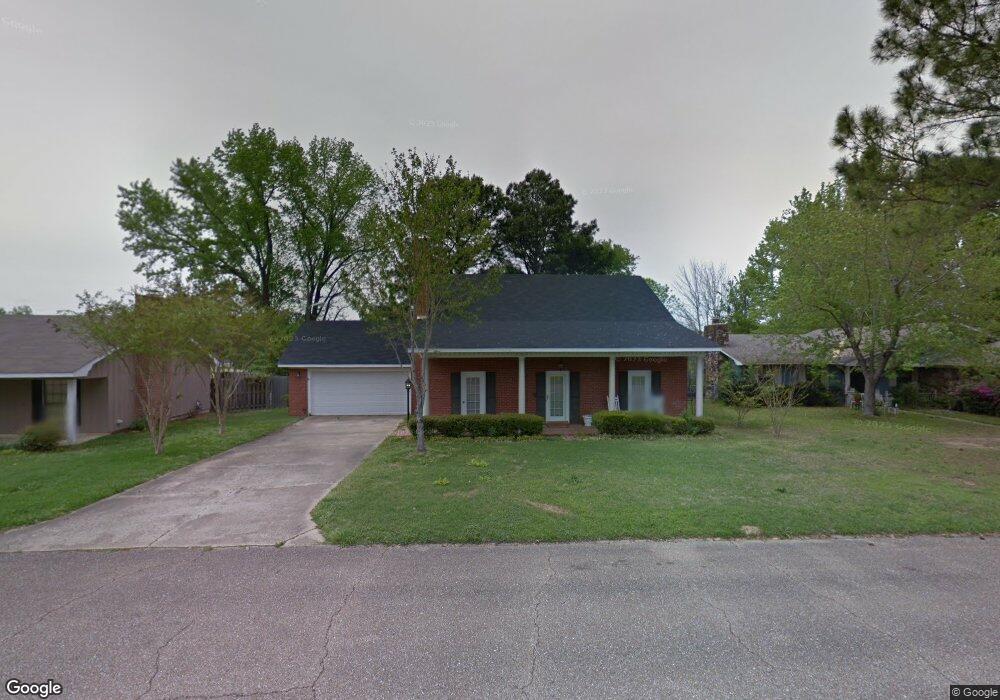
429 Forrest Ct Columbus, MS 39702
Estimated Value: $146,374 - $173,000
Studio
--
Bath
2,381
Sq Ft
$66/Sq Ft
Est. Value
About This Home
This home is located at 429 Forrest Ct, Columbus, MS 39702 and is currently estimated at $156,594, approximately $65 per square foot. 429 Forrest Ct is a home with nearby schools including Columbus Middle School, Columbus High School, and Annunciation Catholic School.
Ownership History
Date
Name
Owned For
Owner Type
Purchase Details
Closed on
Apr 19, 2023
Sold by
Brown Cynthia
Bought by
Brown Cynthia
Current Estimated Value
Home Financials for this Owner
Home Financials are based on the most recent Mortgage that was taken out on this home.
Original Mortgage
$134,310
Outstanding Balance
$130,542
Interest Rate
6.75%
Mortgage Type
FHA
Estimated Equity
$26,052
Purchase Details
Closed on
May 25, 2007
Sold by
Brady Steven K and Brady Stephanie T
Bought by
Mcmath Cynthia
Home Financials for this Owner
Home Financials are based on the most recent Mortgage that was taken out on this home.
Original Mortgage
$112,360
Interest Rate
6.1%
Purchase Details
Closed on
Jul 21, 2005
Sold by
Mccrimon Harold Lynn and Mccrimon Loria
Bought by
Brady Steven K and Brady Stephanie T
Home Financials for this Owner
Home Financials are based on the most recent Mortgage that was taken out on this home.
Original Mortgage
$100,000
Interest Rate
5.51%
Create a Home Valuation Report for This Property
The Home Valuation Report is an in-depth analysis detailing your home's value as well as a comparison with similar homes in the area
Purchase History
| Date | Buyer | Sale Price | Title Company |
|---|---|---|---|
| Brown Cynthia | -- | None Listed On Document | |
| Brown Cynthia | -- | None Listed On Document | |
| Mcmath Cynthia | $123,000 | -- | |
| Brady Steven K | -- | -- |
Source: Public Records
Mortgage History
| Date | Status | Borrower | Loan Amount |
|---|---|---|---|
| Open | Brown Cynthia | $134,310 | |
| Closed | Brown Cynthia | $134,310 | |
| Previous Owner | Mcmath Cynthia | $112,360 | |
| Previous Owner | Brady Steven K | $100,000 |
Source: Public Records
Tax History
| Year | Tax Paid | Tax Assessment Tax Assessment Total Assessment is a certain percentage of the fair market value that is determined by local assessors to be the total taxable value of land and additions on the property. | Land | Improvement |
|---|---|---|---|---|
| 2025 | $1,941 | $11,883 | $0 | $0 |
| 2024 | $1,917 | $11,883 | $0 | $0 |
| 2023 | $1,683 | $10,291 | $0 | $0 |
| 2022 | $1,691 | $10,291 | $0 | $0 |
| 2021 | $1,627 | $10,291 | $0 | $0 |
| 2020 | $1,288 | $10,291 | $0 | $0 |
| 2019 | $1,224 | $10,179 | $0 | $0 |
| 2018 | $1,224 | $10,061 | $0 | $0 |
| 2017 | $0 | $10,061 | $0 | $0 |
| 2016 | $1,138 | $10,061 | $0 | $0 |
| 2015 | -- | $10,277 | $0 | $0 |
| 2014 | -- | $10,277 | $0 | $0 |
Source: Public Records
Map
Nearby Homes
Your Personal Tour Guide
Ask me questions while you tour the home.