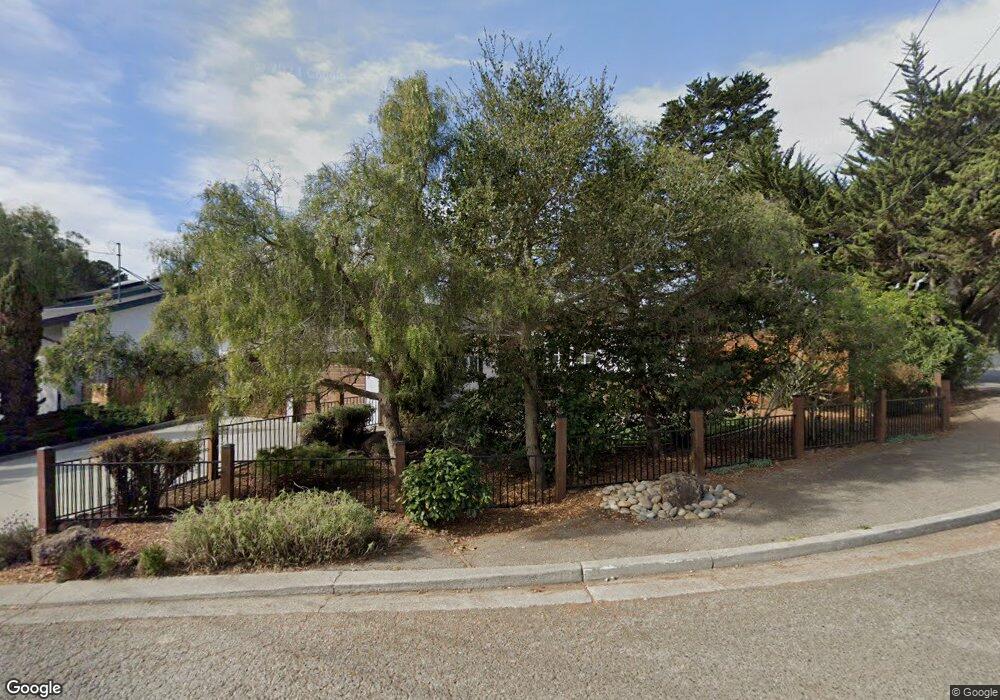
429 Locke Dr Aptos, CA 95003
Rio del Mar NeighborhoodEstimated Value: $1,017,891 - $1,637,000
2
Beds
2
Baths
1,308
Sq Ft
$949/Sq Ft
Est. Value
About This Home
This home is located at 429 Locke Dr, Aptos, CA 95003 and is currently estimated at $1,241,723, approximately $949 per square foot. 429 Locke Dr is a home located in Santa Cruz County with nearby schools including Rio Del Mar Elementary School, Aptos Junior High School, and Aptos High School.
Ownership History
Date
Name
Owned For
Owner Type
Purchase Details
Closed on
Jun 9, 1997
Sold by
Stirling Loren D and Limber Susan E
Bought by
Snellman Ann May L
Current Estimated Value
Home Financials for this Owner
Home Financials are based on the most recent Mortgage that was taken out on this home.
Original Mortgage
$236,400
Outstanding Balance
$32,782
Interest Rate
7.62%
Estimated Equity
$1,208,941
Purchase Details
Closed on
Jul 19, 1994
Sold by
Mccauley Libert George Fred and Mccauley Libert Catherine
Bought by
Stirling Loren D and Limber Susan E
Home Financials for this Owner
Home Financials are based on the most recent Mortgage that was taken out on this home.
Original Mortgage
$184,000
Interest Rate
8.38%
Create a Home Valuation Report for This Property
The Home Valuation Report is an in-depth analysis detailing your home's value as well as a comparison with similar homes in the area
Home Values in the Area
Average Home Value in this Area
Purchase History
| Date | Buyer | Sale Price | Title Company |
|---|---|---|---|
| Snellman Ann May L | $263,000 | Old Republic Title Company | |
| Stirling Loren D | $230,000 | Santa Cruz Title Co |
Source: Public Records
Mortgage History
| Date | Status | Borrower | Loan Amount |
|---|---|---|---|
| Open | Snellman Ann May L | $236,400 | |
| Previous Owner | Stirling Loren D | $184,000 |
Source: Public Records
Tax History
| Year | Tax Paid | Tax Assessment Tax Assessment Total Assessment is a certain percentage of the fair market value that is determined by local assessors to be the total taxable value of land and additions on the property. | Land | Improvement |
|---|---|---|---|---|
| 2025 | $5,871 | $428,353 | $260,594 | $167,759 |
| 2023 | $5,714 | $411,720 | $250,475 | $161,245 |
| 2022 | $5,566 | $403,647 | $245,564 | $158,083 |
| 2021 | $5,328 | $395,732 | $240,749 | $154,983 |
| 2020 | $5,229 | $391,674 | $238,280 | $153,394 |
| 2019 | $5,133 | $383,995 | $233,608 | $150,387 |
| 2018 | $4,986 | $376,466 | $229,028 | $147,438 |
| 2017 | $4,930 | $369,083 | $224,537 | $144,546 |
| 2016 | $4,814 | $361,846 | $220,134 | $141,712 |
| 2015 | $4,736 | $356,410 | $216,827 | $139,583 |
| 2014 | $4,618 | $349,429 | $212,580 | $136,849 |
Source: Public Records
Map
Nearby Homes
- 615 Clubhouse Dr
- 507 La Honda Dr
- 0 Loma Prieta Dr Unit ML82034156
- 457 Monterey Dr
- 630 Encino Dr
- 513 Encino Dr
- 329 Los Altos Dr
- 322 Arthur Ave
- 801 Cresta Vista Way
- 610 Nestora Ave
- 610 Rio Del Mar Blvd
- 457 Townsend Dr
- 812 Loma Prieta Dr
- 511 Cliff Dr
- 0 Encino Dr Unit ML81996921
- 619 Beach Dr
- 433 Seaview Dr
- 547 Beach Dr
- 545 Beach Dr
- 227 Kingsbury Dr
Your Personal Tour Guide
Ask me questions while you tour the home.