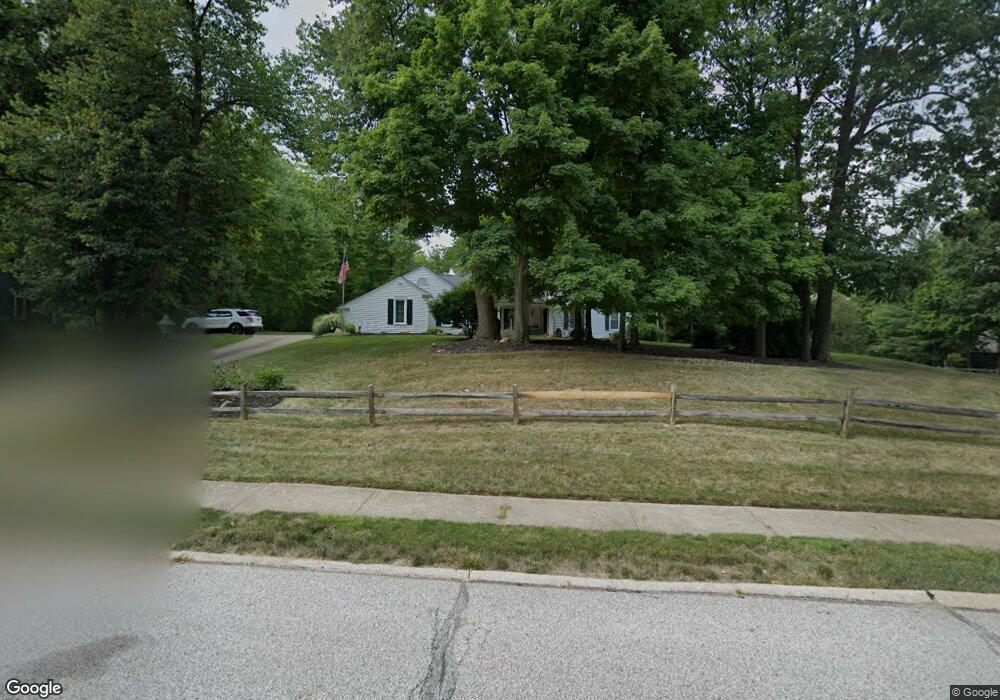
429 Millpond Rd Aurora, OH 44202
Estimated Value: $533,000 - $636,000
4
Beds
3
Baths
3,403
Sq Ft
$167/Sq Ft
Est. Value
About This Home
This home is located at 429 Millpond Rd, Aurora, OH 44202 and is currently estimated at $567,233, approximately $166 per square foot. 429 Millpond Rd is a home located in Portage County with nearby schools including Miller Elementary School, Craddock/Miller Elementary School, and Leighton Elementary School.
Ownership History
Date
Name
Owned For
Owner Type
Purchase Details
Closed on
Oct 29, 2015
Sold by
Post Russell D and Post Sandra J
Bought by
Post Sandra J and Sandra J Post Trust
Current Estimated Value
Purchase Details
Closed on
Apr 23, 2015
Sold by
Post Sandra J and The Sandra J Post Trust
Bought by
Post Russell D and Post Sandra J
Home Financials for this Owner
Home Financials are based on the most recent Mortgage that was taken out on this home.
Original Mortgage
$180,000
Interest Rate
3.68%
Mortgage Type
New Conventional
Purchase Details
Closed on
Mar 31, 2003
Sold by
Post Russell D and Post Sandra J
Bought by
Post Sandra J and Sandra J Post Trust
Purchase Details
Closed on
May 8, 1996
Sold by
Zang Alan M
Bought by
National City Bank
Create a Home Valuation Report for This Property
The Home Valuation Report is an in-depth analysis detailing your home's value as well as a comparison with similar homes in the area
Home Values in the Area
Average Home Value in this Area
Purchase History
| Date | Buyer | Sale Price | Title Company |
|---|---|---|---|
| Post Sandra J | -- | Attorney | |
| Post Russell D | -- | None Available | |
| Post Sandra J | -- | -- | |
| National City Bank | $276,500 | -- |
Source: Public Records
Mortgage History
| Date | Status | Borrower | Loan Amount |
|---|---|---|---|
| Closed | Post Russell D | $180,000 |
Source: Public Records
Tax History
| Year | Tax Paid | Tax Assessment Tax Assessment Total Assessment is a certain percentage of the fair market value that is determined by local assessors to be the total taxable value of land and additions on the property. | Land | Improvement |
|---|---|---|---|---|
| 2025 | $8,304 | $182,460 | $29,260 | $153,200 |
| 2024 | $8,156 | $182,460 | $29,260 | $153,200 |
| 2023 | $7,837 | $142,730 | $29,260 | $113,470 |
| 2022 | $7,097 | $142,730 | $29,260 | $113,470 |
| 2021 | $7,137 | $142,730 | $29,260 | $113,470 |
| 2020 | $6,353 | $118,620 | $29,260 | $89,360 |
| 2019 | $6,404 | $118,620 | $29,260 | $89,360 |
| 2018 | $6,213 | $104,620 | $26,950 | $77,670 |
| 2017 | $6,213 | $104,620 | $26,950 | $77,670 |
| 2016 | $5,599 | $104,620 | $26,950 | $77,670 |
| 2015 | $5,757 | $104,620 | $26,950 | $77,670 |
| 2014 | $5,788 | $103,080 | $26,950 | $76,130 |
| 2013 | $5,751 | $103,080 | $26,950 | $76,130 |
Source: Public Records
Map
Nearby Homes
- 635 Prestige Woods Blvd
- 132 Eldridge Rd
- 984 Hawkin Ln
- 123 S Chillicothe Rd
- 824 S Chillicothe Rd Unit 11
- 74 Hurd Rd
- V/L 14 AC Ohio 82
- 0 W Mennonite Rd
- 970 S Chillicothe Rd
- 159 Royal Oak Dr
- 294 S Park Dr
- 0 Aurora Hill Dr Unit 3956102
- 800 Hampton Cir Unit 6
- 279 Tinkers Trail Unit 38K
- 441-13 Knollwood Dr
- 520-18 Willow Cir
- 512-11 Overlook Dr
- 290-21 Hawthorne Dr
- 504-9 Concord Downs Cir Unit 9
- 196 Chisholm Ct
- 409 Millpond Rd
- 548 Fox Run Trail
- 418 Millpond Rd
- 551 Fox Run Trail
- 408 Millpond Rd
- 540 Fox Run Trail
- 555 Fox Run Trail
- 541 Cobblestone Rd
- 381 Millpond Rd
- 557 Fox Run Trail
- 380 Millpond Rd
- 521 Fox Run Trail
- 521 Cobblestone Rd
- 506 Fox Run Trail
- 342 Millpond Rd
- 454 Foxhill Dr
- 509 Cobblestone Rd
- 505 Fox Run Trail
- 312 Millpond Rd
- 540 Cobblestone Rd
Your Personal Tour Guide
Ask me questions while you tour the home.