
Seller's Agent in 2019
Randy Placencia
Red Bridge Real Estate
(317) 800-4342
5 in this area
279 Total Sales

Estimated Value: $170,000 - $195,560
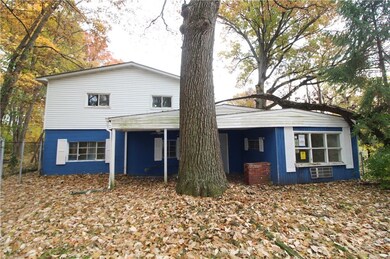
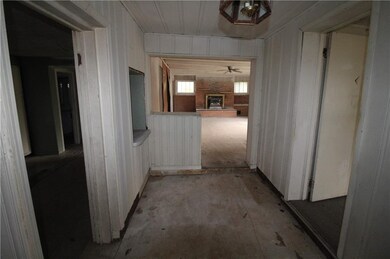
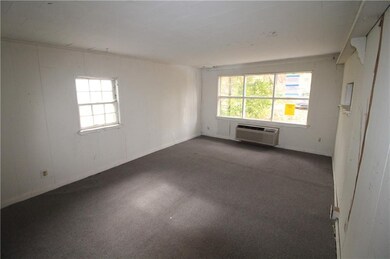
This home is located at 429 N Gibson Ave, Indianapolis, IN 46219 since 05 November 2018 and is currently estimated at $182,640, approximately $101 per square foot. This property was built in 1947. 429 N Gibson Ave is a home located in Marion County with nearby schools including Hawthorne Elementary School, Raymond Park Intermediate School (5-6), and Raymond Park Middle School.
Last Agent to Sell the Property
Red Bridge Real Estate License #RB14045562 Listed on: 11/05/2018
Last Buyer's Agent
Luis Coronel
Coronel Realty Group
| Date | Buyer | Sale Price | Title Company |
|---|---|---|---|
| Hernandez Antonio Pascual | -- | None Available | |
| -- | $14,500 | -- | |
| Indy Investments Llc | $14,500 | Monument Title Insurance Compa | |
| -- | $25,500 | -- | |
| Simple Quarters Llc | $25,500 | Monument Title Insurance Compa | |
| Midfirst Bank | -- | -- | |
| Hud | -- | None Available | |
| Mdfirst Bank | -- | None Available | |
| The Sec Of Hud | $40,694 | Foutty & Foutty Llp | |
| Secretary Of Housing & Urban Development | -- | None Available | |
| Midfirst Bank | $40,693 | None Available | |
| Midfirst Bank Business | $40,694 | Foutty & Foutty Llp |
| Date | Event | Price | List to Sale | Price per Sq Ft |
|---|---|---|---|---|
| 01/29/2019 01/29/19 | Sold | $36,900 | 0.0% | $20 / Sq Ft |
| 01/22/2019 01/22/19 | Pending | -- | -- | -- |
| 01/07/2019 01/07/19 | Price Changed | $36,900 | -5.1% | $20 / Sq Ft |
| 12/17/2018 12/17/18 | Price Changed | $38,900 | -11.4% | $22 / Sq Ft |
| 12/05/2018 12/05/18 | Price Changed | $43,900 | -8.4% | $24 / Sq Ft |
| 11/21/2018 11/21/18 | Price Changed | $47,900 | 0.0% | $27 / Sq Ft |
| 11/21/2018 11/21/18 | For Sale | $47,900 | -7.7% | $27 / Sq Ft |
| 11/07/2018 11/07/18 | Pending | -- | -- | -- |
| 11/05/2018 11/05/18 | For Sale | $51,900 | -- | $29 / Sq Ft |
| Year | Tax Paid | Tax Assessment Tax Assessment Total Assessment is a certain percentage of the fair market value that is determined by local assessors to be the total taxable value of land and additions on the property. | Land | Improvement |
|---|---|---|---|---|
| 2024 | $1,075 | $104,600 | $16,000 | $88,600 |
| 2023 | $1,075 | $104,600 | $16,000 | $88,600 |
| 2022 | $1,041 | $97,000 | $16,000 | $81,000 |
| 2021 | $923 | $87,000 | $16,000 | $71,000 |
| 2020 | $1,835 | $78,400 | $16,000 | $62,400 |
| 2019 | $1,718 | $73,100 | $14,000 | $59,100 |
| 2018 | $1,560 | $66,100 | $14,000 | $52,100 |
| 2017 | $1,447 | $67,500 | $14,000 | $53,500 |
| 2016 | $1,343 | $62,400 | $14,000 | $48,400 |
| 2014 | $1,185 | $59,000 | $14,000 | $45,000 |
| 2013 | $1,210 | $60,200 | $14,000 | $46,200 |
Seller's Agent in 2019
Randy Placencia
Red Bridge Real Estate
(317) 800-4342
5 in this area
279 Total Sales
L
Buyer's Agent in 2019
Luis Coronel
Coronel Realty Group
Source: MIBOR Broker Listing Cooperative®
MLS Number: MBR21606018
APN: 49-09-06-111-018.000-700
Disclaimer: Certain information contained herein is derived from information provided by parties other than Homes.com. All information provided is deemed reliable, but is not guaranteed to be accurate and should be independently verified.
![]() Based on information submitted to the MLS GRID. All data is obtained from various sources and may not have been verified by broker or MLS GRID. Supplied Open House Information is subject to change without notice. All information should be independently reviewed and verified for accuracy. Properties may or may not be listed by the office/agent presenting the information. Some IDX listings have been excluded from this website.
Based on information submitted to the MLS GRID. All data is obtained from various sources and may not have been verified by broker or MLS GRID. Supplied Open House Information is subject to change without notice. All information should be independently reviewed and verified for accuracy. Properties may or may not be listed by the office/agent presenting the information. Some IDX listings have been excluded from this website.