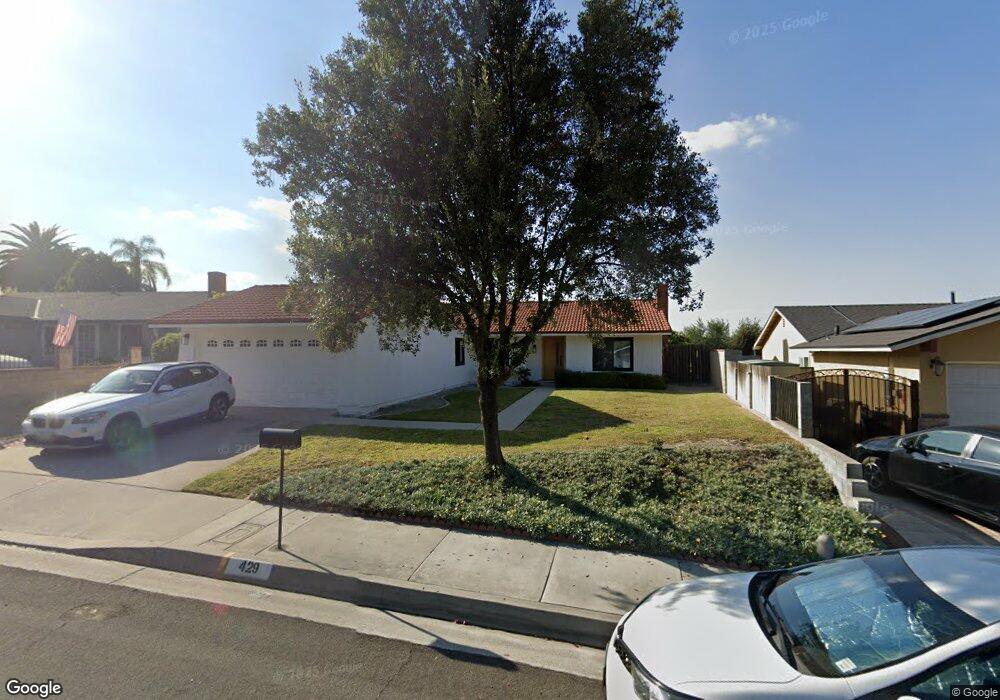
429 N Prospectors Rd Diamond Bar, CA 91765
Estimated Value: $874,000 - $961,000
3
Beds
2
Baths
1,677
Sq Ft
$536/Sq Ft
Est. Value
About This Home
This home is located at 429 N Prospectors Rd, Diamond Bar, CA 91765 and is currently estimated at $899,329, approximately $536 per square foot. 429 N Prospectors Rd is a home located in Los Angeles County with nearby schools including Armstrong Elementary School, Lorbeer Middle School, and Diamond Ranch High School.
Ownership History
Date
Name
Owned For
Owner Type
Purchase Details
Closed on
Apr 21, 2025
Sold by
Chow Rachel Wing Han and Chow Rachel Winghan
Bought by
Chow Rachel Winghan
Current Estimated Value
Home Financials for this Owner
Home Financials are based on the most recent Mortgage that was taken out on this home.
Original Mortgage
$100,000
Outstanding Balance
$99,556
Interest Rate
6.65%
Mortgage Type
Credit Line Revolving
Estimated Equity
$799,773
Purchase Details
Closed on
Jul 20, 2020
Sold by
Chow Rachel Wing Han and Chow Wing Han
Bought by
Chow Rachel Wing Han
Home Financials for this Owner
Home Financials are based on the most recent Mortgage that was taken out on this home.
Original Mortgage
$352,000
Interest Rate
3.1%
Mortgage Type
New Conventional
Purchase Details
Closed on
Jun 4, 2009
Sold by
Federal Home Loan Mortgage Corporation
Bought by
Chow Wing Han
Home Financials for this Owner
Home Financials are based on the most recent Mortgage that was taken out on this home.
Original Mortgage
$311,200
Interest Rate
4.83%
Mortgage Type
Purchase Money Mortgage
Purchase Details
Closed on
Jul 9, 2008
Sold by
Bravo Jose M
Bought by
Federal Home Loan Mortgage Corporation
Purchase Details
Closed on
Jun 9, 2004
Sold by
Kim Jong Jin and Kim Yeon Jin
Bought by
Bravo Jose M
Home Financials for this Owner
Home Financials are based on the most recent Mortgage that was taken out on this home.
Original Mortgage
$373,600
Interest Rate
4%
Mortgage Type
Purchase Money Mortgage
Purchase Details
Closed on
Jun 26, 2001
Sold by
Arabian Ali
Bought by
Kim Jong Jin and Kim Yeon Jin
Home Financials for this Owner
Home Financials are based on the most recent Mortgage that was taken out on this home.
Original Mortgage
$231,800
Interest Rate
7.09%
Purchase Details
Closed on
Jan 15, 1997
Sold by
Arabian Elham
Bought by
Arabian Ali
Home Financials for this Owner
Home Financials are based on the most recent Mortgage that was taken out on this home.
Original Mortgage
$137,500
Interest Rate
7.58%
Purchase Details
Closed on
Dec 30, 1996
Sold by
Southern States Realty
Bought by
Arabian Ali
Home Financials for this Owner
Home Financials are based on the most recent Mortgage that was taken out on this home.
Original Mortgage
$137,500
Interest Rate
7.58%
Purchase Details
Closed on
Sep 23, 1996
Sold by
Riddle Alan and Riddle Elenor
Bought by
Southern States Realty
Create a Home Valuation Report for This Property
The Home Valuation Report is an in-depth analysis detailing your home's value as well as a comparison with similar homes in the area
Home Values in the Area
Average Home Value in this Area
Purchase History
| Date | Buyer | Sale Price | Title Company |
|---|---|---|---|
| Chow Rachel Winghan | -- | Monarch Title | |
| Chow Rachel Wing Han | -- | Pacific Coast Title Company | |
| Chow Wing Han | $389,000 | Ticor Title Redlands | |
| Federal Home Loan Mortgage Corporation | $395,900 | Accommodation | |
| Bravo Jose M | $467,000 | Security Union Title Company | |
| Kim Jong Jin | $239,000 | Chicago Title | |
| Arabian Ali | -- | Chicago Title | |
| Arabian Ali | $153,000 | Chicago Title | |
| Southern States Realty | $159,500 | Chicago Title |
Source: Public Records
Mortgage History
| Date | Status | Borrower | Loan Amount |
|---|---|---|---|
| Open | Chow Rachel Winghan | $100,000 | |
| Previous Owner | Chow Rachel Wing Han | $352,000 | |
| Previous Owner | Chow Wing Han | $311,200 | |
| Previous Owner | Bravo Jose M | $373,600 | |
| Previous Owner | Kim Jong Jin | $231,800 | |
| Previous Owner | Arabian Ali | $137,500 | |
| Closed | Bravo Jose M | $46,700 |
Source: Public Records
Tax History Compared to Growth
Tax History
| Year | Tax Paid | Tax Assessment Tax Assessment Total Assessment is a certain percentage of the fair market value that is determined by local assessors to be the total taxable value of land and additions on the property. | Land | Improvement |
|---|---|---|---|---|
| 2025 | $6,412 | $500,922 | $337,771 | $163,151 |
| 2024 | $6,412 | $491,101 | $331,149 | $159,952 |
| 2023 | $6,288 | $481,472 | $324,656 | $156,816 |
| 2022 | $6,189 | $472,033 | $318,291 | $153,742 |
| 2021 | $6,049 | $462,778 | $312,050 | $150,728 |
| 2020 | $6,027 | $458,034 | $308,851 | $149,183 |
| 2019 | $6,175 | $449,054 | $302,796 | $146,258 |
| 2018 | $5,696 | $440,250 | $296,859 | $143,391 |
| 2016 | $5,343 | $423,157 | $285,333 | $137,824 |
| 2015 | $5,297 | $416,802 | $281,048 | $135,754 |
| 2014 | $5,258 | $408,638 | $275,543 | $133,095 |
Source: Public Records
Map
Nearby Homes
- 22603 Dry Creek Rd
- 331 N Pintado Dr
- 22100 Portofino Dr
- 22129 Portofino Dr
- 22092 Portofino Dr
- 22090 Portofino Dr
- 374 S Prospectors Rd Unit 126
- 23675 Bower Cascade Place
- 22085 Manarola Way
- 22060 Manarola Way
- 22058 Manarola Way
- 23817 Decorah Rd
- 23659 Golden Springs Dr Unit 3F
- 23617 Golden Springs Dr
- 23629 Golden Springs Dr Unit H-2
- 226 Roma Ct
- 22013 Florence Cir
- 221 Roma Ct
- 325 El Encino Dr
- 22046 Florence Cir
- 423 N Prospectors Rd
- 435 N Prospectors Rd
- 22718 Jura Rd
- 441 N Prospectors Rd
- 417 N Prospectors Rd
- 428 Rockbridge Rd
- 426 N Prospectors Rd
- 420 Rockbridge Rd
- 434 Rockbridge Rd
- 436 N Prospectors Rd
- 449 N Prospectors Rd
- 411 N Prospectors Rd
- 418 N Prospectors Rd
- 442 Rockbridge Rd
- 442 N Prospectors Rd
- 412 Rockbridge Rd
- 22729 Jura Rd
- 455 N Prospectors Rd
- 410 N Prospectors Rd
- 450 N Prospectors Rd