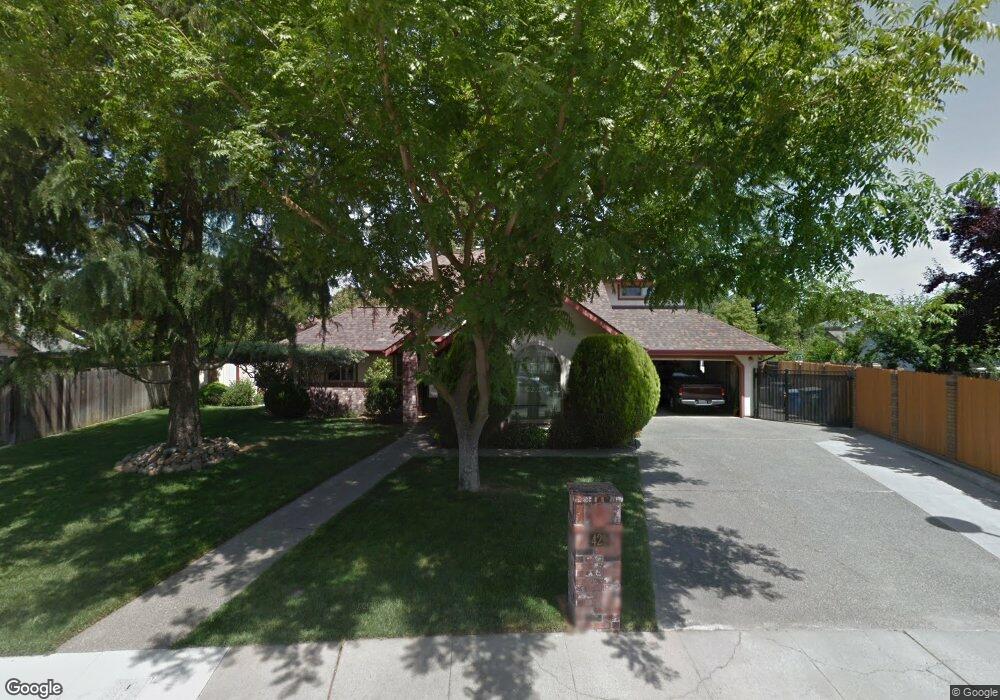
429 Nasca Way Sacramento, CA 95831
Pocket-Greenhaven NeighborhoodEstimated Value: $576,000 - $833,000
4
Beds
3
Baths
2,600
Sq Ft
$279/Sq Ft
Est. Value
About This Home
This home is located at 429 Nasca Way, Sacramento, CA 95831 and is currently estimated at $726,468, approximately $279 per square foot. 429 Nasca Way is a home located in Sacramento County with nearby schools including Martin Luther King, Jr School, Sam Brannan Middle School, and John F. Kennedy High School.
Ownership History
Date
Name
Owned For
Owner Type
Purchase Details
Closed on
Mar 21, 2018
Sold by
Flores Edward Virgil
Bought by
Flores Edward V and Edward V Flores Revocable Trus
Current Estimated Value
Purchase Details
Closed on
Mar 12, 2018
Sold by
Ellis Diane and Ellis Diane L
Bought by
Flores Edward Virgil
Purchase Details
Closed on
Apr 16, 2007
Sold by
Va
Bought by
Flores Edward Vigil and Flores Diane L
Purchase Details
Closed on
May 7, 2001
Sold by
Flores Edward Vigil
Bought by
Flores Edward V and Edward V Flores Revocable Trus
Purchase Details
Closed on
May 3, 1994
Sold by
Flores Diane L
Bought by
Flores Edward Vigil
Home Financials for this Owner
Home Financials are based on the most recent Mortgage that was taken out on this home.
Original Mortgage
$42,500
Interest Rate
7.84%
Create a Home Valuation Report for This Property
The Home Valuation Report is an in-depth analysis detailing your home's value as well as a comparison with similar homes in the area
Home Values in the Area
Average Home Value in this Area
Purchase History
| Date | Buyer | Sale Price | Title Company |
|---|---|---|---|
| Flores Edward V | -- | None Available | |
| Flores Edward Virgil | -- | None Available | |
| Flores Edward Vigil | -- | None Available | |
| Flores Edward V | -- | -- | |
| Flores Edward Vigil | -- | Commonwealth Land Title |
Source: Public Records
Mortgage History
| Date | Status | Borrower | Loan Amount |
|---|---|---|---|
| Previous Owner | Flores Edward Vigil | $42,500 |
Source: Public Records
Tax History Compared to Growth
Tax History
| Year | Tax Paid | Tax Assessment Tax Assessment Total Assessment is a certain percentage of the fair market value that is determined by local assessors to be the total taxable value of land and additions on the property. | Land | Improvement |
|---|---|---|---|---|
| 2025 | $3,728 | $294,798 | $59,025 | $235,773 |
| 2024 | $3,728 | $289,018 | $57,868 | $231,150 |
| 2023 | $3,634 | $283,352 | $56,734 | $226,618 |
| 2022 | $3,587 | $277,797 | $55,622 | $222,175 |
| 2021 | $3,418 | $272,351 | $54,532 | $217,819 |
| 2020 | $3,436 | $269,559 | $53,973 | $215,586 |
| 2019 | $3,364 | $264,274 | $52,915 | $211,359 |
| 2018 | $3,277 | $259,093 | $51,878 | $207,215 |
| 2017 | $3,229 | $254,013 | $50,861 | $203,152 |
| 2016 | $3,142 | $249,033 | $49,864 | $199,169 |
| 2015 | $3,040 | $245,293 | $49,115 | $196,178 |
| 2014 | $2,968 | $240,489 | $48,153 | $192,336 |
Source: Public Records
Map
Nearby Homes
- 420 Seagull Way
- 462 de Mar Dr
- 625 Valim Way
- 4 Marina Blue Ct
- 4 Bingham Cir
- 10 Fleet Ct
- 7716 George River Ln
- 487 Twin River Way
- 4 Park River Oak Ct
- 6980 Riverside Blvd
- 0 Riverside Blvd
- 763 La Contenta Way
- 5 Dumfries Ct
- 7922 Collins Isle Ln
- 9 Sandhill Ct
- 6797 Frates Way
- 506 Roundtree Ct
- 14 Westlite Ct
- 1 Sandpointe Ct
- 6810 Arabella Way
- 423 Nasca Way
- 7422 Salton Sea Way
- 7418 Salton Sea Way
- 430 Mariner Point Way
- 7414 Salton Sea Way
- 426 Mariner Point Way
- 434 Mariner Point Way
- 422 Mariner Point Way
- 7410 Salton Sea Way
- 438 Mariner Point Way
- 7430 Salton Sea Way
- 418 Mariner Point Way
- 419 Nasca Way
- 428 Nasca Way
- 442 Mariner Point Way
- 7434 Salton Sea Way
- 420 Nasca Way
- 446 Mariner Point Way
- 2 Waterfront Ct
- 7438 Salton Sea Way