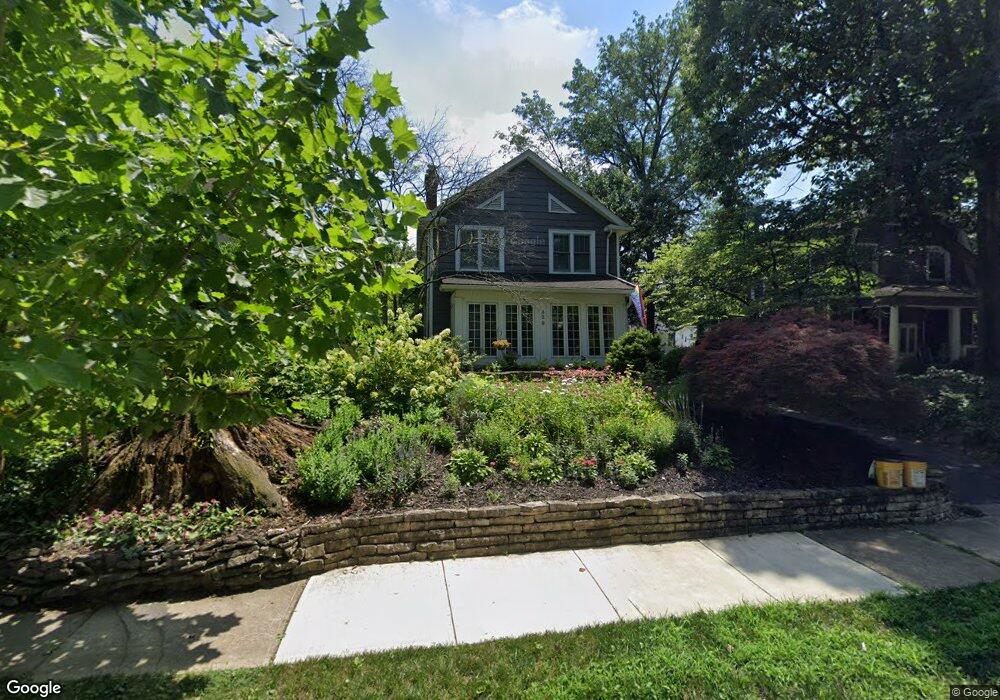
429 Piedmont Rd Columbus, OH 43214
Clintonville NeighborhoodEstimated Value: $522,000 - $600,000
3
Beds
2
Baths
1,544
Sq Ft
$357/Sq Ft
Est. Value
About This Home
This home is located at 429 Piedmont Rd, Columbus, OH 43214 and is currently estimated at $550,555, approximately $356 per square foot. 429 Piedmont Rd is a home located in Franklin County with nearby schools including Clinton Elementary School, Dominion Middle School, and Whetstone High School.
Ownership History
Date
Name
Owned For
Owner Type
Purchase Details
Closed on
Aug 27, 2024
Sold by
Stackpole Janet M and Kennett Mary A
Bought by
Kim Angie J and Borrell Lauren N
Current Estimated Value
Home Financials for this Owner
Home Financials are based on the most recent Mortgage that was taken out on this home.
Original Mortgage
$327,000
Outstanding Balance
$323,528
Interest Rate
6.77%
Mortgage Type
New Conventional
Estimated Equity
$227,027
Purchase Details
Closed on
Jul 26, 1999
Sold by
Wilson Terry L
Bought by
Kennett Mary A
Home Financials for this Owner
Home Financials are based on the most recent Mortgage that was taken out on this home.
Original Mortgage
$148,650
Interest Rate
7.69%
Purchase Details
Closed on
Feb 20, 1985
Bought by
Wilson Terry L
Create a Home Valuation Report for This Property
The Home Valuation Report is an in-depth analysis detailing your home's value as well as a comparison with similar homes in the area
Home Values in the Area
Average Home Value in this Area
Purchase History
| Date | Buyer | Sale Price | Title Company |
|---|---|---|---|
| Kim Angie J | $586,000 | Northwest Title | |
| Kennett Mary A | $174,900 | Franklin Abstract | |
| Wilson Terry L | $65,000 | -- |
Source: Public Records
Mortgage History
| Date | Status | Borrower | Loan Amount |
|---|---|---|---|
| Open | Kim Angie J | $327,000 | |
| Previous Owner | Kennett Mary A | $148,650 |
Source: Public Records
Tax History Compared to Growth
Tax History
| Year | Tax Paid | Tax Assessment Tax Assessment Total Assessment is a certain percentage of the fair market value that is determined by local assessors to be the total taxable value of land and additions on the property. | Land | Improvement |
|---|---|---|---|---|
| 2024 | $6,096 | $135,840 | $57,120 | $78,720 |
| 2023 | $6,019 | $135,835 | $57,120 | $78,715 |
| 2022 | $6,624 | $127,720 | $37,240 | $90,480 |
| 2021 | $6,636 | $127,720 | $37,240 | $90,480 |
| 2020 | $6,645 | $127,720 | $37,240 | $90,480 |
| 2019 | $6,005 | $98,990 | $28,670 | $70,320 |
| 2018 | $5,086 | $93,600 | $28,670 | $64,930 |
| 2017 | $5,469 | $93,600 | $28,670 | $64,930 |
| 2016 | $5,263 | $79,450 | $31,920 | $47,530 |
| 2015 | $4,506 | $74,940 | $31,920 | $43,020 |
| 2014 | $4,517 | $74,940 | $31,920 | $43,020 |
| 2013 | $2,172 | $71,365 | $30,415 | $40,950 |
Source: Public Records
Map
Nearby Homes
- 467 Brevoort Rd
- 540 Fallis Rd
- 419 E North Broadway St
- 217 Arden Rd
- 374 Acton Rd
- 541 Northridge Rd
- 455 Walhalla Rd
- 569 Walhalla Rd
- 219 E Como Ave
- 3386 Beulah Rd
- 296 Walhalla Rd
- 780 Moon Rd
- 612 E Como Ave
- 3726 N High St
- 36 Brighton Rd
- 876 Lenore Ave
- 886 Carolyn Ave
- 685 Yaronia Dr N
- 88 W Kenworth Rd
- 788 E Brighton Rd
- 423 Piedmont Rd
- 437 Piedmont Rd
- 443 Piedmont Rd
- 449 Piedmont Rd
- 424 E Dunedin Rd
- 424 E Dunedin Rd Unit CLINTONVILLE
- 416 E Dunedin Rd
- 430 E Dunedin Rd
- 436 E Dunedin Rd
- 455 Piedmont Rd
- 405 Piedmont Rd
- 432 Piedmont Rd
- 442 E Dunedin Rd
- 426 Piedmont Rd
- 440 Piedmont Rd
- 446 Piedmont Rd
- 397 Piedmont Rd
- 396 E Dunedin Rd
- 448 E Dunedin Rd
- 463 Piedmont Rd