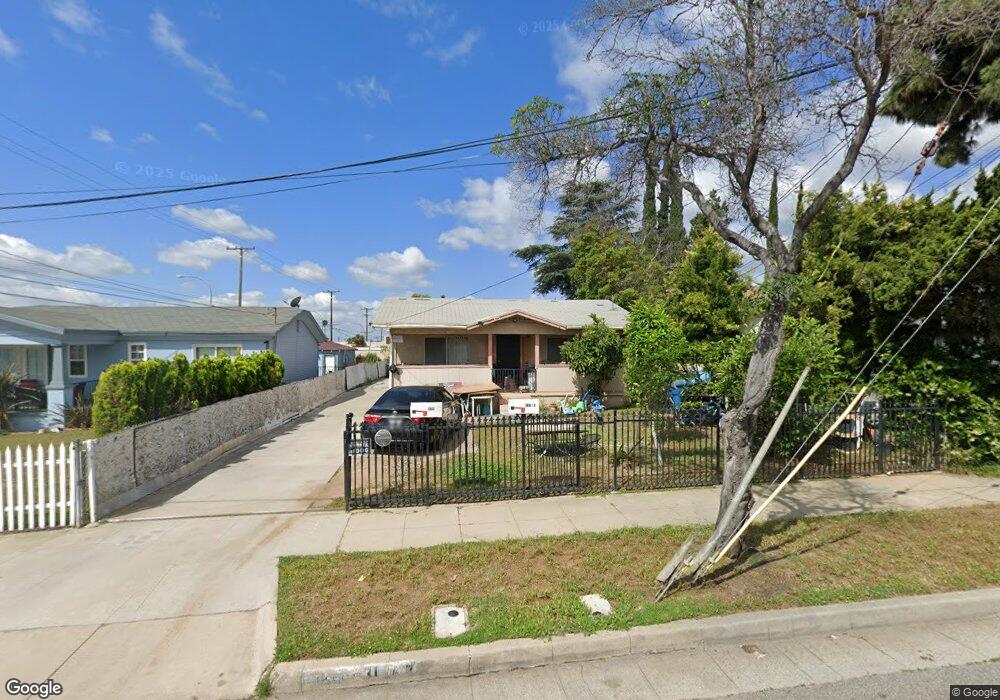
429 S 7th St Alhambra, CA 91801
Alhambra Vista NeighborhoodEstimated Value: $841,000 - $1,442,000
6
Beds
3
Baths
2,235
Sq Ft
$523/Sq Ft
Est. Value
About This Home
This home is located at 429 S 7th St, Alhambra, CA 91801 and is currently estimated at $1,168,517, approximately $522 per square foot. 429 S 7th St is a home located in Los Angeles County with nearby schools including William Northrup Elementary School, Alhambra High School, and All Souls World Language Catholic School.
Ownership History
Date
Name
Owned For
Owner Type
Purchase Details
Closed on
Jun 11, 2009
Sold by
Lum Kune Ko
Bought by
Lum Kune Ko and Kune Ko Lum Family Trust
Current Estimated Value
Purchase Details
Closed on
Jun 18, 1998
Sold by
Lum Kune Ko and Quach Liet Phan
Bought by
Lum Kune Ko and Quach Liet Phan
Home Financials for this Owner
Home Financials are based on the most recent Mortgage that was taken out on this home.
Original Mortgage
$173,000
Outstanding Balance
$34,971
Interest Rate
7.17%
Mortgage Type
Purchase Money Mortgage
Estimated Equity
$1,133,546
Purchase Details
Closed on
Dec 23, 1996
Sold by
Ocampo Mary Decd Est Of
Bought by
Lum Kune Ko and Dao Bang Le
Home Financials for this Owner
Home Financials are based on the most recent Mortgage that was taken out on this home.
Original Mortgage
$173,400
Interest Rate
7.86%
Mortgage Type
FHA
Create a Home Valuation Report for This Property
The Home Valuation Report is an in-depth analysis detailing your home's value as well as a comparison with similar homes in the area
Home Values in the Area
Average Home Value in this Area
Purchase History
| Date | Buyer | Sale Price | Title Company |
|---|---|---|---|
| Lum Kune Ko | -- | None Available | |
| Quach Liet Phan | -- | None Available | |
| Lum Kune Ko | -- | United Title Company | |
| Lum Kuna Ko | -- | United Title | |
| Lum Kune Ko | $190,000 | Old Republic Title | |
| Lum Kune Ko | -- | Old Republic Title |
Source: Public Records
Mortgage History
| Date | Status | Borrower | Loan Amount |
|---|---|---|---|
| Open | Lum Kuna Ko | $173,000 | |
| Closed | Lum Kune Ko | $173,000 | |
| Previous Owner | Lum Kune Ko | $173,400 |
Source: Public Records
Tax History Compared to Growth
Tax History
| Year | Tax Paid | Tax Assessment Tax Assessment Total Assessment is a certain percentage of the fair market value that is determined by local assessors to be the total taxable value of land and additions on the property. | Land | Improvement |
|---|---|---|---|---|
| 2025 | $4,402 | $309,262 | $102,975 | $206,287 |
| 2024 | $4,402 | $303,199 | $100,956 | $202,243 |
| 2023 | $4,460 | $297,255 | $98,977 | $198,278 |
| 2022 | $4,279 | $291,428 | $97,037 | $194,391 |
| 2021 | $4,229 | $285,715 | $95,135 | $190,580 |
| 2020 | $4,208 | $282,786 | $94,160 | $188,626 |
| 2019 | $4,099 | $277,242 | $92,314 | $184,928 |
| 2018 | $3,990 | $271,806 | $90,504 | $181,302 |
| 2016 | $3,688 | $261,254 | $86,991 | $174,263 |
| 2015 | $3,637 | $257,331 | $85,685 | $171,646 |
| 2014 | $3,611 | $252,291 | $84,007 | $168,284 |
Source: Public Records
Map
Nearby Homes
- 806 W Commonwealth Ave Unit 14
- 713 S 8th St
- 213 S Atlantic Blvd
- 228 S Olive Ave Unit A302
- 580 W Main St Unit 323
- 802 S Olive Ave
- 410 W Main St Unit 231
- 25 Palmetto Dr Unit E
- 1145 S 3rd St
- 88 E Bay State St Unit 1F
- 210 N Atlantic Blvd Unit A
- 78 E Bay State St Unit 1E
- 200 N 5th St Unit 311
- 200 N 5th St Unit 108
- 200 N 5th St Unit 101
- 111 Los Higos St
- 89 E Commonwealth Ave Unit 1I
- 745 S Chapel Ave
- 1100 S Stoneman Ave
- 22 N Electric Ave