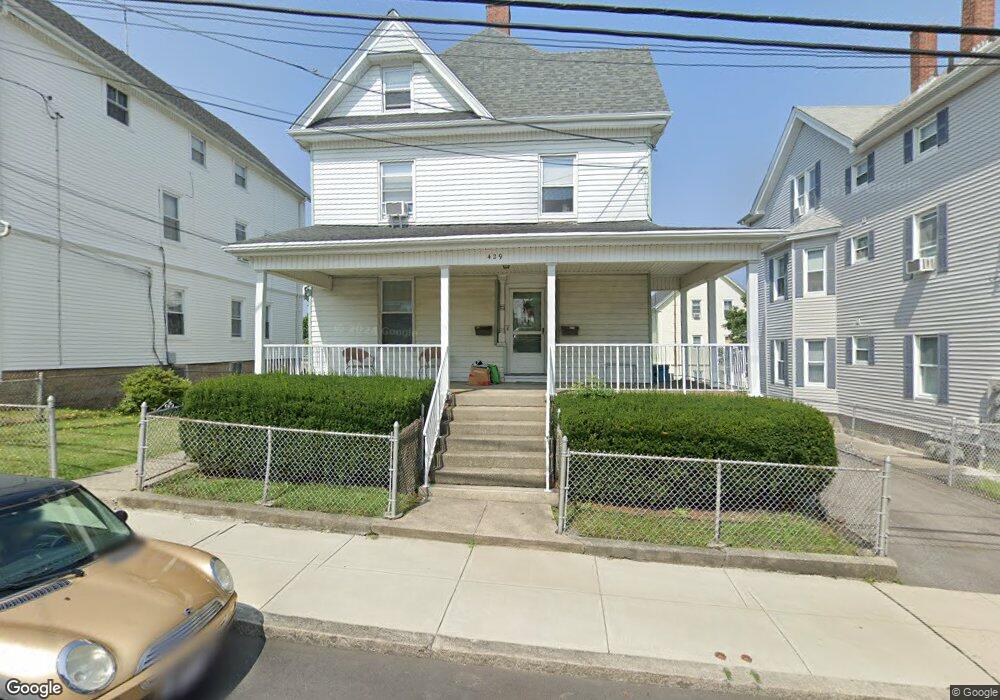
429 S Beach St Fall River, MA 02724
Sandy Beach NeighborhoodEstimated Value: $543,099 - $627,000
7
Beds
3
Baths
3,199
Sq Ft
$181/Sq Ft
Est. Value
About This Home
This home is located at 429 S Beach St, Fall River, MA 02724 and is currently estimated at $580,275, approximately $181 per square foot. 429 S Beach St is a home located in Bristol County with nearby schools including Carlton M. Viveiros Elementary School, Matthew J. Kuss Middle School, and B M C Durfee High School.
Ownership History
Date
Name
Owned For
Owner Type
Purchase Details
Closed on
Apr 13, 1999
Sold by
Dias Elise
Bought by
Harrington Cynthia A
Current Estimated Value
Create a Home Valuation Report for This Property
The Home Valuation Report is an in-depth analysis detailing your home's value as well as a comparison with similar homes in the area
Home Values in the Area
Average Home Value in this Area
Purchase History
| Date | Buyer | Sale Price | Title Company |
|---|---|---|---|
| Harrington Cynthia A | $135,000 | -- |
Source: Public Records
Mortgage History
| Date | Status | Borrower | Loan Amount |
|---|---|---|---|
| Open | Harrington Cynthia A | $142,000 | |
| Closed | Harrington Cynthia A | $50,000 | |
| Closed | Harrington Cynthia A | $133,500 |
Source: Public Records
Tax History
| Year | Tax Paid | Tax Assessment Tax Assessment Total Assessment is a certain percentage of the fair market value that is determined by local assessors to be the total taxable value of land and additions on the property. | Land | Improvement |
|---|---|---|---|---|
| 2025 | $5,489 | $479,400 | $109,800 | $369,600 |
| 2024 | $5,256 | $457,400 | $105,800 | $351,600 |
| 2023 | $4,606 | $375,400 | $87,400 | $288,000 |
| 2022 | $4,100 | $324,900 | $83,300 | $241,600 |
| 2021 | $3,878 | $280,400 | $79,200 | $201,200 |
| 2020 | $3,497 | $242,000 | $78,000 | $164,000 |
| 2019 | $2,996 | $205,500 | $75,200 | $130,300 |
| 2018 | $2,972 | $203,300 | $81,400 | $121,900 |
| 2017 | $2,793 | $199,500 | $77,600 | $121,900 |
| 2016 | $2,745 | $201,400 | $82,600 | $118,800 |
| 2015 | $2,634 | $201,400 | $82,600 | $118,800 |
| 2014 | $2,647 | $210,400 | $80,100 | $130,300 |
Source: Public Records
Map
Nearby Homes
- 70 Brown St
- 420 Bradford Ave
- 303 Eagle St Unit C
- 403 Division St Unit 13
- 403 Division St Unit 5
- 403 Division St Unit 9
- 403 Division St Unit 11
- 403 Division St Unit 12
- 403 Division St Unit 1
- 403 Division St Unit 18
- 334 Fountain St
- 700 Shore Dr Unit 6-604
- 700 Shore Dr Unit 1205
- 700 Shore Dr Unit 810
- 330 William St
- 271 Mulberry St
- 169 Grant St
- 165 Grant St
- 640 S Main St
- 1273-1279 S Main St
- 419 S Beach St
- 435 S Beach St
- 411 S Beach St
- 411 S Beach St Unit 2
- 411 S Beach St Unit 1
- 520 S Almond St
- 520 S Almond St
- 451 S Beach St
- 4 Oliver St
- 377 Middle St Unit 2-R
- 377 Middle St Unit 4
- 377 Middle St Unit 1
- 377 Middle St
- 540 S Almond St Unit 1b
- 540 S Almond St Unit 3
- 540 S Almond St
- 522 S Almond St Unit A
- 522 S Almond St Unit 1st
- 522 S Almond St
- 5 Oliver St
Your Personal Tour Guide
Ask me questions while you tour the home.