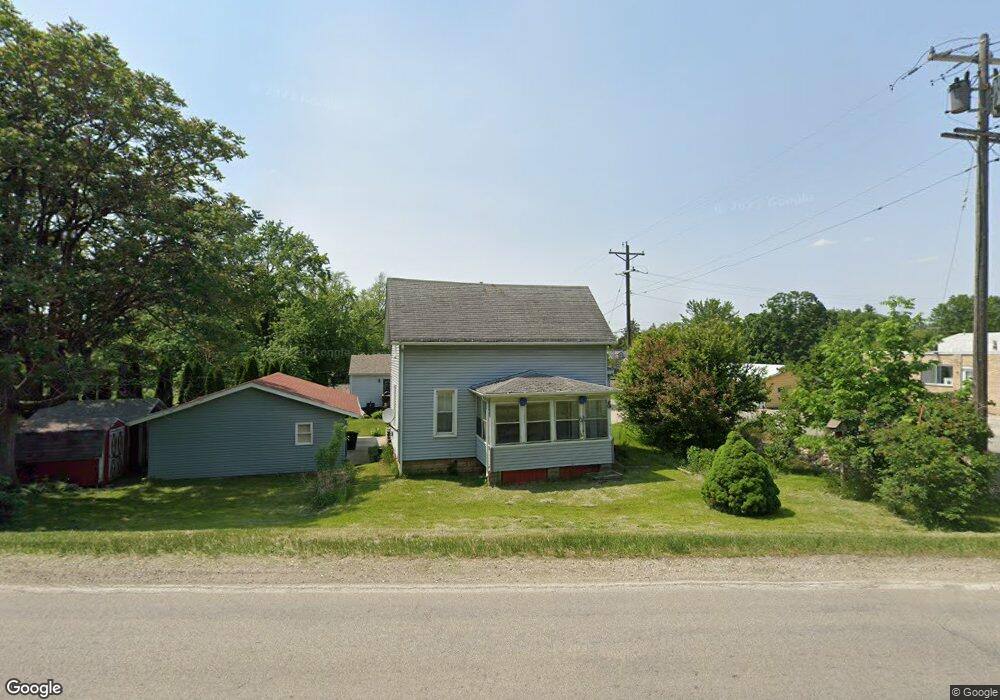
429 State Ave Hampton, IL 61256
Estimated Value: $105,000 - $163,000
2
Beds
1
Bath
1,159
Sq Ft
$115/Sq Ft
Est. Value
About This Home
This home is located at 429 State Ave, Hampton, IL 61256 and is currently estimated at $133,742, approximately $115 per square foot. 429 State Ave is a home located in Rock Island County with nearby schools including Hampton Elementary School, United Township High School, and Our Lady Of Grace.
Ownership History
Date
Name
Owned For
Owner Type
Purchase Details
Closed on
Sep 18, 2023
Sold by
Morris Rickey and Morris Ronnie
Bought by
Morris Brandon
Current Estimated Value
Home Financials for this Owner
Home Financials are based on the most recent Mortgage that was taken out on this home.
Original Mortgage
$66,400
Outstanding Balance
$65,028
Interest Rate
7.1%
Mortgage Type
New Conventional
Estimated Equity
$68,714
Purchase Details
Closed on
Sep 20, 2019
Sold by
Anderson Gary J and Anderson Ronda S
Bought by
Morris Rickey
Create a Home Valuation Report for This Property
The Home Valuation Report is an in-depth analysis detailing your home's value as well as a comparison with similar homes in the area
Purchase History
| Date | Buyer | Sale Price | Title Company |
|---|---|---|---|
| Morris Brandon | $83,000 | None Listed On Document | |
| Morris Rickey | $50,000 | Midwest Community Title |
Source: Public Records
Mortgage History
| Date | Status | Borrower | Loan Amount |
|---|---|---|---|
| Open | Morris Brandon | $66,400 |
Source: Public Records
Tax History
| Year | Tax Paid | Tax Assessment Tax Assessment Total Assessment is a certain percentage of the fair market value that is determined by local assessors to be the total taxable value of land and additions on the property. | Land | Improvement |
|---|---|---|---|---|
| 2024 | $2,654 | $33,258 | $7,539 | $25,719 |
| 2023 | $2,654 | $31,170 | $7,066 | $24,104 |
| 2022 | $2,546 | $28,876 | $6,547 | $22,329 |
| 2021 | $2,439 | $27,606 | $6,259 | $21,347 |
| 2020 | $2,399 | $27,252 | $6,179 | $21,073 |
| 2019 | $2,414 | $26,757 | $6,067 | $20,690 |
| 2018 | $965 | $20,083 | $3,710 | $16,373 |
| 2017 | $919 | $16,535 | $3,641 | $12,894 |
| 2016 | $909 | $16,453 | $3,623 | $12,830 |
| 2015 | $885 | $16,130 | $3,552 | $12,578 |
| 2014 | -- | $15,725 | $3,463 | $12,262 |
| 2013 | -- | $15,725 | $3,463 | $12,262 |
Source: Public Records
Map
Nearby Homes
- LOT 201 James St
- 23 Cherry Hill Ct Unit 124
- 115 8th St
- 728 10th Avenue Ct
- 729 10th Ave
- 1005 5th Street A
- 513 12th Ave
- 242 S State Ave
- 626 14th Ave
- 24711 178th St
- 0 12th Unit L 13
- Lot 1 Kennedy
- 0 12th Unit L 11
- 0 12th Unit L 3
- 0 12th Unit L 2
- 0 12th Unit L 1
- 0 12th Unit L 14
- 0 12th Unit 17
- 0 12th Unit L 12
- 0 12th Unit L 4
Your Personal Tour Guide
Ask me questions while you tour the home.