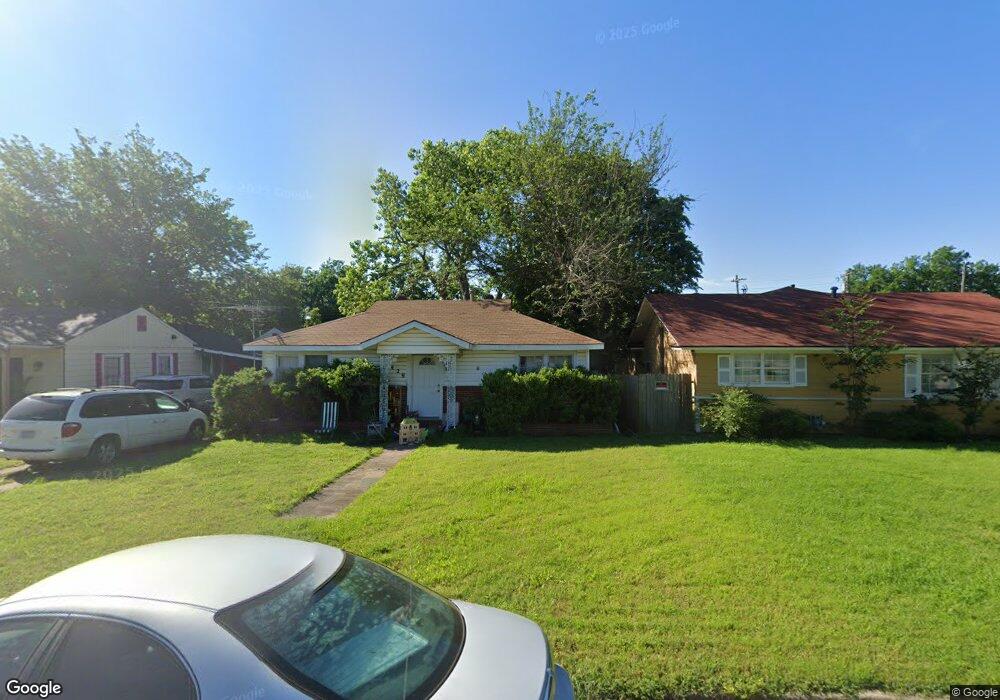
429 Turner St Cleburne, TX 76033
Estimated Value: $192,000 - $199,000
2
Beds
1
Bath
1,239
Sq Ft
$158/Sq Ft
Est. Value
About This Home
This home is located at 429 Turner St, Cleburne, TX 76033 and is currently estimated at $196,205, approximately $158 per square foot. 429 Turner St is a home located in Johnson County with nearby schools including Irving Elementary School, A.D. Wheat Middle School, and Cleburne High School.
Ownership History
Date
Name
Owned For
Owner Type
Purchase Details
Closed on
Jul 28, 2014
Sold by
The Secretary Of Hud
Bought by
North Crystal and North Michael Brian
Current Estimated Value
Home Financials for this Owner
Home Financials are based on the most recent Mortgage that was taken out on this home.
Original Mortgage
$31,500
Outstanding Balance
$24,099
Interest Rate
4.2%
Mortgage Type
Purchase Money Mortgage
Estimated Equity
$172,106
Purchase Details
Closed on
Feb 4, 2014
Sold by
Arriola Jose
Bought by
Wells Fargo Bank Na
Purchase Details
Closed on
Sep 26, 2008
Sold by
Box Gregory and Box Alicia
Bought by
Arriola Jose
Home Financials for this Owner
Home Financials are based on the most recent Mortgage that was taken out on this home.
Original Mortgage
$72,542
Interest Rate
6.52%
Mortgage Type
FHA
Create a Home Valuation Report for This Property
The Home Valuation Report is an in-depth analysis detailing your home's value as well as a comparison with similar homes in the area
Home Values in the Area
Average Home Value in this Area
Purchase History
| Date | Buyer | Sale Price | Title Company |
|---|---|---|---|
| North Crystal | -- | Capital Title | |
| Wells Fargo Bank Na | $45,650 | None Available | |
| Arriola Jose | -- | Fatco |
Source: Public Records
Mortgage History
| Date | Status | Borrower | Loan Amount |
|---|---|---|---|
| Open | North Crystal | $31,500 | |
| Previous Owner | Arriola Jose | $72,542 |
Source: Public Records
Tax History Compared to Growth
Tax History
| Year | Tax Paid | Tax Assessment Tax Assessment Total Assessment is a certain percentage of the fair market value that is determined by local assessors to be the total taxable value of land and additions on the property. | Land | Improvement |
|---|---|---|---|---|
| 2025 | $916 | $193,526 | $43,500 | $150,026 |
| 2024 | $2,184 | $97,965 | $0 | $0 |
| 2023 | $828 | $193,526 | $43,500 | $150,026 |
| 2022 | $2,026 | $107,560 | $28,000 | $79,560 |
| 2021 | $1,920 | $107,560 | $28,000 | $79,560 |
| 2020 | $1,854 | $72,386 | $20,000 | $52,386 |
| 2019 | $1,797 | $72,386 | $20,000 | $52,386 |
| 2018 | $1,635 | $55,299 | $13,000 | $42,299 |
| 2017 | $1,628 | $55,299 | $13,000 | $42,299 |
| 2016 | $1,547 | $52,555 | $11,500 | $41,055 |
| 2015 | $1,128 | $52,555 | $11,500 | $41,055 |
| 2014 | $1,128 | $52,555 | $11,500 | $41,055 |
Source: Public Records
Map
Nearby Homes
- 502 Bales St
- 418 Marengo St
- 508 Bales St
- 701 Poindexter Ave
- 411 Euclid St
- 800 Madison St
- 308 Poindexter Ave
- 807 Poindexter Ave
- 603 Lilly St
- 916 Poindexter Ave
- 1103 N Walnut St
- 704 Graham St
- 1204 N Wood St
- 805 Marengo St
- 808 Marengo St
- 607 N Wood St
- 810 Euclid St
- 107 Woodard Ave
- Sherwood Plan at Craftsman's Corner
- Essex Plan at Craftsman's Corner