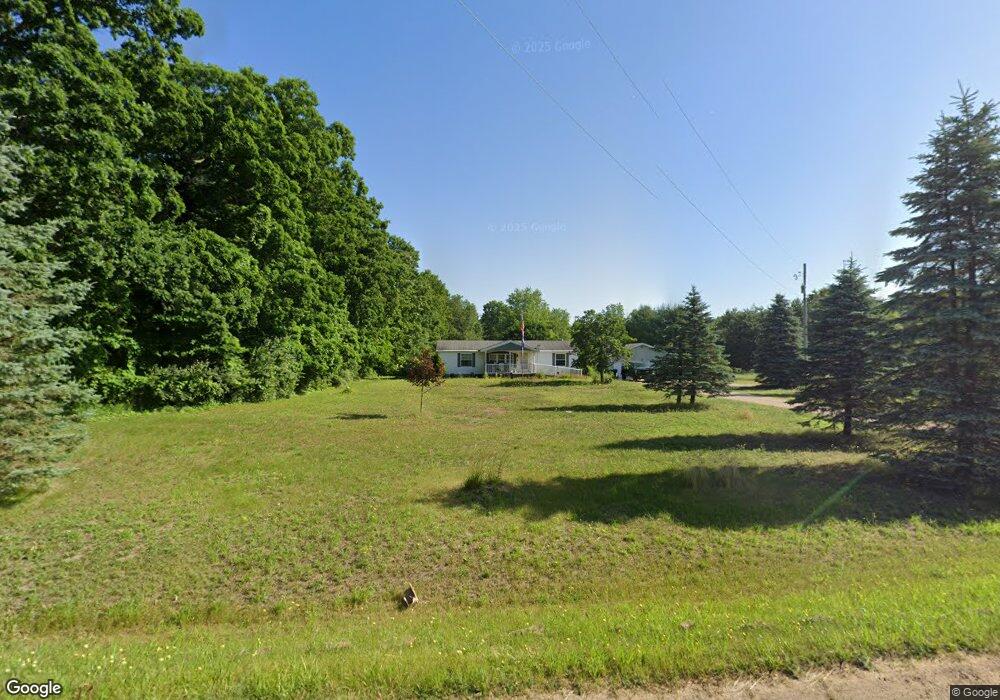
4291 112th Ave Allegan, MI 49010
Estimated Value: $220,000 - $378,170
3
Beds
2
Baths
2,144
Sq Ft
$131/Sq Ft
Est. Value
About This Home
This home is located at 4291 112th Ave, Allegan, MI 49010 and is currently estimated at $281,293, approximately $131 per square foot. 4291 112th Ave is a home located in Allegan County with nearby schools including West Ward Elementary School, L.E. White Middle School, and Allegan High School.
Ownership History
Date
Name
Owned For
Owner Type
Purchase Details
Closed on
Oct 9, 2023
Sold by
Jones Luke G and Jones Max B
Bought by
Jones Luke G
Current Estimated Value
Home Financials for this Owner
Home Financials are based on the most recent Mortgage that was taken out on this home.
Original Mortgage
$112,700
Outstanding Balance
$107,462
Interest Rate
7.12%
Mortgage Type
New Conventional
Estimated Equity
$173,831
Purchase Details
Closed on
Jul 12, 2021
Sold by
Priebe Richard A and Priebe Denise D
Bought by
Priebe Richard A and The Richard Allen Priebe Livin
Purchase Details
Closed on
Apr 13, 2007
Sold by
Long Michael and Long Diane M
Bought by
Priebe Richard A and Priebe Denise D
Home Financials for this Owner
Home Financials are based on the most recent Mortgage that was taken out on this home.
Original Mortgage
$132,552
Interest Rate
6.18%
Mortgage Type
FHA
Create a Home Valuation Report for This Property
The Home Valuation Report is an in-depth analysis detailing your home's value as well as a comparison with similar homes in the area
Home Values in the Area
Average Home Value in this Area
Purchase History
| Date | Buyer | Sale Price | Title Company |
|---|---|---|---|
| Jones Luke G | $20,000 | None Listed On Document | |
| Jones Luke G | $20,000 | None Listed On Document | |
| Priebe Richard A | -- | None Available | |
| Priebe Richard A | -- | Land Title | |
| Priebe Richard A | $133,600 | Chicago Title |
Source: Public Records
Mortgage History
| Date | Status | Borrower | Loan Amount |
|---|---|---|---|
| Open | Jones Luke G | $112,700 | |
| Closed | Jones Luke G | $112,700 | |
| Previous Owner | Priebe Richard A | $132,552 |
Source: Public Records
Tax History Compared to Growth
Tax History
| Year | Tax Paid | Tax Assessment Tax Assessment Total Assessment is a certain percentage of the fair market value that is determined by local assessors to be the total taxable value of land and additions on the property. | Land | Improvement |
|---|---|---|---|---|
| 2025 | $1,964 | $144,200 | $46,000 | $98,200 |
| 2024 | -- | $130,800 | $36,700 | $94,100 |
| 2023 | $1,632 | $114,300 | $29,200 | $85,100 |
| 2022 | $1,632 | $90,700 | $25,700 | $65,000 |
| 2021 | $1,632 | $73,200 | $25,300 | $47,900 |
| 2020 | $1,632 | $61,200 | $25,100 | $36,100 |
| 2019 | $0 | $52,200 | $17,600 | $34,600 |
| 2018 | $0 | $56,700 | $16,100 | $40,600 |
| 2017 | $0 | $46,700 | $16,100 | $30,600 |
| 2016 | $0 | $51,800 | $17,700 | $34,100 |
| 2015 | -- | $51,800 | $17,700 | $34,100 |
| 2014 | -- | $54,800 | $17,700 | $37,100 |
| 2013 | -- | $52,700 | $17,700 | $35,000 |
Source: Public Records
Map
Nearby Homes
- 0 42nd St Unit Rear Land 25022320
- 4338 110th Ave
- 3995 112th Ave
- 3981 112th Ave
- 4579 W 110th Ave
- 3913 112th Ave
- 4272 108th Ave
- 4391 117th Ave
- 1084 38th St
- 1143 38th St
- 4370 Macdougall Dr
- Lot 9 Wildwood Dr
- 1759 Grant Dr
- 4085 Wildwood Dr Unit 1720
- V/L Wintergreen Dr Unit Lot 48
- 919 Armintrout Ridge Ct
- 4330 Moore Rd
- 923 Armintrout Ridge Ct
- 3687 111th Ave
- 304 39th St
- 4329 112th Ave
- 4330 112th Ave
- 4344 112th Ave
- 4300 112th Ave
- 4372 112th Ave
- 4288 112th Ave
- 4384 112th Ave
- 4394 112th Ave
- 4287 112th Ave
- 4273 112th Ave
- 4315 112th Ave
- 4331 112th Ave
- 4271 112th Ave
- 4339 112th Ave
- 4343 112th Ave
- 4364 112th Ave
- 4241 112th Ave
- 1246 42nd St
- 4325 112th Ave
- 0 112th Ave Unit M17003173