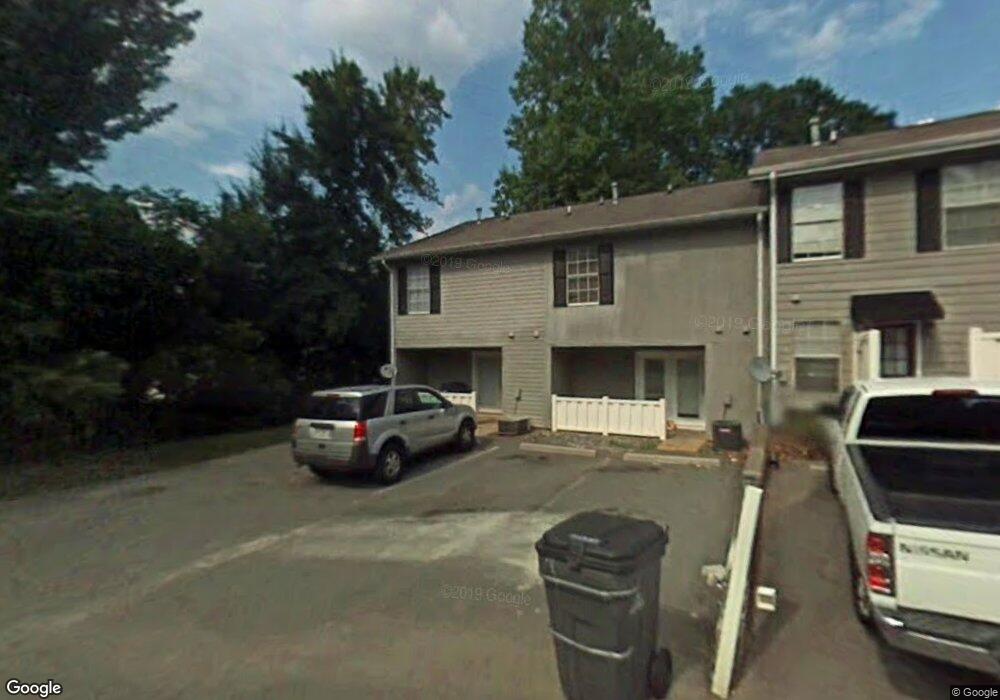
4291 Grogan St NW Unit 4414 Acworth, GA 30101
Estimated Value: $206,085 - $227,000
2
Beds
2
Baths
1,118
Sq Ft
$191/Sq Ft
Est. Value
About This Home
This home is located at 4291 Grogan St NW Unit 4414, Acworth, GA 30101 and is currently estimated at $213,771, approximately $191 per square foot. 4291 Grogan St NW Unit 4414 is a home located in Cobb County with nearby schools including Acworth Intermediate School, McCall Primary School, and Barber Middle School.
Ownership History
Date
Name
Owned For
Owner Type
Purchase Details
Closed on
Jan 19, 2022
Sold by
Key Property Solutions Llc
Bought by
Key Property Portfolio I Llc
Current Estimated Value
Purchase Details
Closed on
Jun 14, 2013
Sold by
Key Property Solutions Llc
Bought by
Key Property Portfolio I
Purchase Details
Closed on
Dec 9, 2008
Sold by
Brock Judith
Bought by
Key Props Solutions Llc
Purchase Details
Closed on
Apr 3, 2007
Sold by
Overstreet Sharon I
Bought by
Last Stop Invest Llc
Purchase Details
Closed on
Mar 21, 2007
Sold by
Last Stop Invest Llc
Bought by
Brock Judith
Purchase Details
Closed on
Mar 17, 2005
Sold by
United Housing Acworth Llc
Bought by
Overstreet Sharon
Home Financials for this Owner
Home Financials are based on the most recent Mortgage that was taken out on this home.
Original Mortgage
$99,000
Interest Rate
7.7%
Mortgage Type
New Conventional
Create a Home Valuation Report for This Property
The Home Valuation Report is an in-depth analysis detailing your home's value as well as a comparison with similar homes in the area
Home Values in the Area
Average Home Value in this Area
Purchase History
| Date | Buyer | Sale Price | Title Company |
|---|---|---|---|
| Key Property Portfolio I Llc | -- | None Listed On Document | |
| Key Property Portfolio I | -- | -- | |
| Key Props Solutions Llc | -- | -- | |
| Last Stop Invest Llc | $50,500 | -- | |
| Brock Judith | -- | -- | |
| Overstreet Sharon | $123,800 | -- |
Source: Public Records
Mortgage History
| Date | Status | Borrower | Loan Amount |
|---|---|---|---|
| Previous Owner | Overstreet Sharon | $99,000 |
Source: Public Records
Tax History Compared to Growth
Tax History
| Year | Tax Paid | Tax Assessment Tax Assessment Total Assessment is a certain percentage of the fair market value that is determined by local assessors to be the total taxable value of land and additions on the property. | Land | Improvement |
|---|---|---|---|---|
| 2024 | $1,647 | $54,624 | $10,000 | $44,624 |
| 2023 | $1,647 | $54,624 | $10,000 | $44,624 |
| 2022 | $1,658 | $54,624 | $10,000 | $44,624 |
| 2021 | $1,247 | $41,080 | $10,000 | $31,080 |
| 2020 | $1,638 | $41,080 | $10,000 | $31,080 |
| 2019 | $977 | $32,188 | $7,200 | $24,988 |
| 2018 | $920 | $30,316 | $8,000 | $22,316 |
| 2017 | $830 | $28,864 | $8,000 | $20,864 |
| 2016 | $550 | $19,128 | $4,000 | $15,128 |
| 2015 | $564 | $19,128 | $4,000 | $15,128 |
| 2014 | $399 | $13,420 | $0 | $0 |
Source: Public Records
Map
Nearby Homes
- 4270 S Main St
- 4269 Westside Dr
- 4384 Westside Dr
- 4128 Worth St NW
- 4478 Pelham Dr
- 4329 Park St
- 4553 Spring St
- 4562 Spring St
- 4610 Old Cowan Rd
- 4304 Hill View Dr
- 3615 High Battery Bluff NW
- 3943 Henry Ct
- 4199 Elderberry Dr NW
- 4091 Fort Sumter Landing NW
- 4308 Southside Dr
- 3949 Golflinks Dr NW
- 3317 Grove Park Terrace NW Unit 1
- 4289 Grogan St NW Unit 4404
- 4289 Grogan St NW Unit 4289
- 4287 Grogan St NW Unit 4392
- 4287 Grogan St NW Unit 4287
- 4285 Grogan St NW Unit 4382
- 4283 Grogan St NW
- 4281 Grogan St NW
- 4281 Grogan St NW Unit 4281
- 4279 Grogan St NW Unit 4350
- 4305 S Main St
- 4277 Grogan St NW
- 4275 Grogan St NW Unit 4332
- 4288 Worth St NW Unit 4379
- 4288 Worth St NW
- 4286 Worth St NW
- 4286 Worth St NW
- 4306 Worth St NW
- 4284 Worth St NW Unit 4355
- 4282 Worth St NW Unit 4345
- 4282 Worth St NW Unit 4282