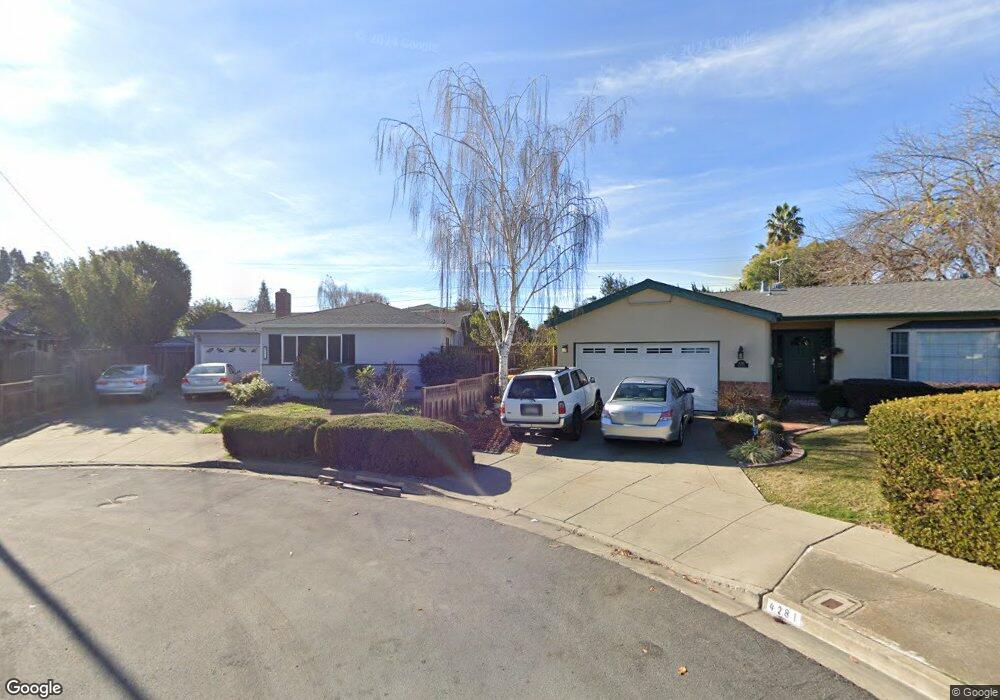
4293 Marie Ct Fremont, CA 94536
Glenmoor NeighborhoodEstimated Value: $1,442,824 - $1,681,000
3
Beds
2
Baths
1,452
Sq Ft
$1,049/Sq Ft
Est. Value
About This Home
This home is located at 4293 Marie Ct, Fremont, CA 94536 and is currently estimated at $1,523,206, approximately $1,049 per square foot. 4293 Marie Ct is a home located in Alameda County with nearby schools including Tom Maloney Elementary School, Centerville Junior High School, and Washington High School.
Ownership History
Date
Name
Owned For
Owner Type
Purchase Details
Closed on
Nov 4, 2022
Sold by
Yu Gong and Guy Jia
Bought by
Li Yu Family Trust
Current Estimated Value
Purchase Details
Closed on
Aug 12, 2013
Sold by
Madge Carole A and Carole A Madge Trust
Bought by
Yu Gong and Li Jia
Home Financials for this Owner
Home Financials are based on the most recent Mortgage that was taken out on this home.
Original Mortgage
$417,000
Interest Rate
4.28%
Mortgage Type
New Conventional
Purchase Details
Closed on
May 15, 1998
Sold by
Madge Carole A
Bought by
Madge Carole A and Carole A Madge Trust
Purchase Details
Closed on
Apr 28, 1995
Sold by
Madge Carole A
Bought by
Madge Carole A
Home Financials for this Owner
Home Financials are based on the most recent Mortgage that was taken out on this home.
Original Mortgage
$50,000
Interest Rate
8.46%
Create a Home Valuation Report for This Property
The Home Valuation Report is an in-depth analysis detailing your home's value as well as a comparison with similar homes in the area
Home Values in the Area
Average Home Value in this Area
Purchase History
| Date | Buyer | Sale Price | Title Company |
|---|---|---|---|
| Li Yu Family Trust | -- | -- | |
| Yu Gong | $620,000 | Chicago Title Company | |
| Madge Carole A | -- | -- | |
| Madge Carole A | -- | Fidelity National Title |
Source: Public Records
Mortgage History
| Date | Status | Borrower | Loan Amount |
|---|---|---|---|
| Previous Owner | Yu Gong | $417,000 | |
| Previous Owner | Madge Carole A | $50,000 |
Source: Public Records
Tax History Compared to Growth
Tax History
| Year | Tax Paid | Tax Assessment Tax Assessment Total Assessment is a certain percentage of the fair market value that is determined by local assessors to be the total taxable value of land and additions on the property. | Land | Improvement |
|---|---|---|---|---|
| 2025 | $9,182 | $753,002 | $245,162 | $514,840 |
| 2024 | $9,182 | $738,103 | $240,356 | $504,747 |
| 2023 | $8,933 | $730,496 | $235,644 | $494,852 |
| 2022 | $8,813 | $709,174 | $231,024 | $485,150 |
| 2021 | $8,597 | $695,137 | $226,496 | $475,641 |
| 2020 | $8,610 | $694,939 | $224,174 | $470,765 |
| 2019 | $8,512 | $681,318 | $219,780 | $461,538 |
| 2018 | $8,344 | $667,963 | $215,472 | $452,491 |
| 2017 | $8,135 | $654,868 | $211,248 | $443,620 |
| 2016 | $7,994 | $642,028 | $207,106 | $434,922 |
| 2015 | $7,886 | $632,387 | $203,996 | $428,391 |
| 2014 | $7,749 | $620,000 | $200,000 | $420,000 |
Source: Public Records
Map
Nearby Homes
- 39090 Presidio Way Unit 237
- 4237 Garland Dr
- 38837 Fremont Blvd
- 4328 Cognina Ct
- 39134 Memorial St
- 39530 Dorrington Ct
- 4714 Serra Ave
- 38265 Corrigan Ct
- 4754 Northdale Dr
- 38611 Country Common
- 4715 Eggers Dr
- 39511 Pardee Ct
- 3275 Capitol Ave
- 3833 Burton Common
- 3810 Burton Common
- 4586 Norris Rd
- 4600 Nelson St
- 38030 Dundee Common
- 3455 Gilman Common
- 38324 Blacow Rd
- 4281 Marie Ct
- 4290 Marie Ct
- 38924 Emrol Ave
- 4269 Marie Ct
- 4280 Marie Ct
- 4302 Gertrude Dr
- 38900 Emrol Ave
- 4282 Argonaut Ct
- 4257 Marie Ct
- 4256 Marie Ct
- 4270 Argonaut Ct
- 38898 Emrol Ave
- 4291 Mowry Ave
- 4279 Mowry Ave
- 4303 Mowry Ave
- 4320 Gertrude Dr
- 4292 Argonaut Ct
- 4267 Mowry Ave
- 4303 Gertrude Dr
- 4319 Mowry Ave