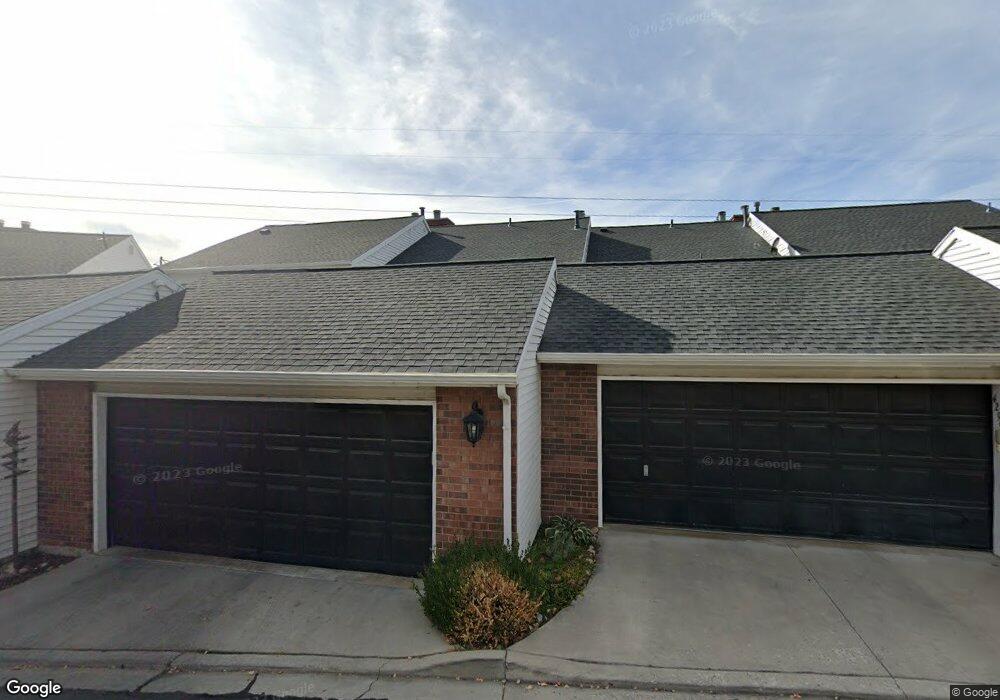
4295 Ivy Ln Provo, UT 84604
Rock Canyon NeighborhoodEstimated Value: $501,837 - $512,000
4
Beds
4
Baths
2,376
Sq Ft
$213/Sq Ft
Est. Value
About This Home
This home is located at 4295 Ivy Ln, Provo, UT 84604 and is currently estimated at $506,279, approximately $213 per square foot. 4295 Ivy Ln is a home located in Utah County with nearby schools including Canyon Crest Elementary School, Centennial Middle School, and Timpview High School.
Ownership History
Date
Name
Owned For
Owner Type
Purchase Details
Closed on
Nov 27, 2015
Sold by
Catledge Janie C
Bought by
Perry Valori Infanger and Perry William David
Current Estimated Value
Home Financials for this Owner
Home Financials are based on the most recent Mortgage that was taken out on this home.
Original Mortgage
$195,200
Outstanding Balance
$80,926
Interest Rate
3.71%
Mortgage Type
New Conventional
Estimated Equity
$425,353
Purchase Details
Closed on
Mar 19, 2008
Sold by
Impact Real Estate Llc
Bought by
Impact Residential Llc
Purchase Details
Closed on
Jul 13, 2005
Sold by
Catledge James B and Catledge Tiffany C
Bought by
Impact Real Estate Llc
Purchase Details
Closed on
Apr 17, 2003
Sold by
Catledge Janie
Bought by
Catledge Janie C
Home Financials for this Owner
Home Financials are based on the most recent Mortgage that was taken out on this home.
Original Mortgage
$152,000
Interest Rate
4.25%
Mortgage Type
Purchase Money Mortgage
Create a Home Valuation Report for This Property
The Home Valuation Report is an in-depth analysis detailing your home's value as well as a comparison with similar homes in the area
Home Values in the Area
Average Home Value in this Area
Purchase History
| Date | Buyer | Sale Price | Title Company |
|---|---|---|---|
| Perry Valori Infanger | -- | Keystone Title Ins Agen | |
| Impact Residential Llc | -- | None Available | |
| Impact Real Estate Llc | -- | -- | |
| Catledge Janie C | -- | Mountain West Title Co |
Source: Public Records
Mortgage History
| Date | Status | Borrower | Loan Amount |
|---|---|---|---|
| Open | Perry Valori Infanger | $195,200 | |
| Previous Owner | Catledge Janie C | $152,000 |
Source: Public Records
Tax History
| Year | Tax Paid | Tax Assessment Tax Assessment Total Assessment is a certain percentage of the fair market value that is determined by local assessors to be the total taxable value of land and additions on the property. | Land | Improvement |
|---|---|---|---|---|
| 2025 | $2,501 | $249,975 | -- | -- |
| 2024 | $2,501 | $246,180 | $0 | $0 |
| 2023 | $2,296 | $223,685 | $0 | $0 |
| 2022 | $2,474 | $242,110 | $0 | $0 |
| 2021 | $2,080 | $355,000 | $42,600 | $312,400 |
| 2020 | $2,052 | $328,200 | $39,400 | $288,800 |
| 2019 | $1,785 | $297,000 | $33,000 | $264,000 |
| 2018 | $1,630 | $275,000 | $33,000 | $242,000 |
| 2017 | $1,487 | $137,830 | $0 | $0 |
| 2016 | $1,476 | $127,600 | $0 | $0 |
| 2015 | $1,244 | $108,625 | $0 | $0 |
| 2014 | $1,193 | $108,625 | $0 | $0 |
Source: Public Records
Map
Nearby Homes
- 4299 Ivy Ln
- 981 Waterford Dr Unit 5&6
- 4529 Windsor Dr
- 4277 N Imperial Way Unit 347
- 4612 N Bristol Cir
- 1085 Windsor Dr
- 4640 Brookshire Cir
- 4006 Sherwood Dr
- 4601 Foothill Dr
- 3702 N 920 E
- 645 Foothill Dr
- 4161 N Canyon Rd Unit 2
- 407 E 3900 Rd N Unit 1
- 407 E 3900 Rd N
- 3442 Navajo Ln
- 299 E 4000 N
- 528 E 3750 N
- 285 Three Fountains Dr
- 3411 N Piute Dr
- 3711 N Canyon Rd
- 4291 N Ivy Ln
- 4291 Ivy Ln
- 4303 Ivy Ln
- 4279 Ivy Ln
- 4275 Ivy Ln
- 4271 Ivy Ln
- 4313 Ivy Ln
- 4309 Ivy Ln
- 4317 Ivy Ln
- 4321 Ivy Ln
- 4325 Ivy Ln
- 4304 Windsor Dr
- 4322 Foothill Dr Unit 4
- 4296 Churchill Dr
- 1071 Waterford Ln
- 4292 Churchill Dr
- 4321 Windsor Dr
- 4336 N Wimbledon Dr Unit 3
- 4242 Windsor Dr
- 4334 Foothill Dr
Your Personal Tour Guide
Ask me questions while you tour the home.