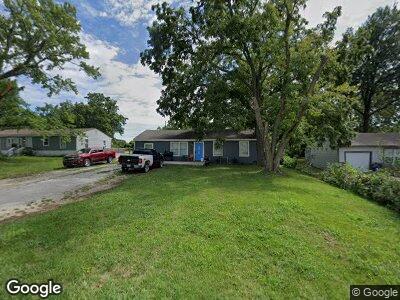
4297 Doctor Greaves Rd Grandview, MO 64030
Estimated Value: $148,000 - $223,000
3
Beds
1
Bath
1,152
Sq Ft
$165/Sq Ft
Est. Value
About This Home
This home is located at 4297 Doctor Greaves Rd, Grandview, MO 64030 and is currently estimated at $190,381, approximately $165 per square foot. 4297 Doctor Greaves Rd is a home located in Jackson County with nearby schools including Warford Elementary School, Ruskin High School, and Forerunner Christian Academy.
Ownership History
Date
Name
Owned For
Owner Type
Purchase Details
Closed on
May 22, 2012
Sold by
Harbour Portgolio Vii Lp
Bought by
Galaviz Oscar and Najera Maria
Current Estimated Value
Purchase Details
Closed on
Dec 22, 2011
Sold by
Federal National Mortgage Association
Bought by
Harbour Portfolio Vii Lp
Purchase Details
Closed on
May 12, 2011
Sold by
Donner Kelli
Bought by
Federal National Mortgage Association
Purchase Details
Closed on
May 31, 2000
Sold by
Donner Kelli R
Bought by
Donner Kelli R and Nesbit Derek
Home Financials for this Owner
Home Financials are based on the most recent Mortgage that was taken out on this home.
Original Mortgage
$43,260
Interest Rate
8.17%
Mortgage Type
Purchase Money Mortgage
Purchase Details
Closed on
Feb 17, 2000
Sold by
Michelle Gray
Bought by
Gray Brent S and Gray Vickie D
Create a Home Valuation Report for This Property
The Home Valuation Report is an in-depth analysis detailing your home's value as well as a comparison with similar homes in the area
Home Values in the Area
Average Home Value in this Area
Purchase History
| Date | Buyer | Sale Price | Title Company |
|---|---|---|---|
| Galaviz Oscar | -- | None Available | |
| Harbour Portfolio Vii Lp | $6,485 | Service Link | |
| Federal National Mortgage Association | $54,363 | Mokan Title Services Llc | |
| Donner Kelli R | -- | Realty Title Company | |
| Donner Kelli R | -- | Chicago Title Co | |
| Gray Brent S | -- | -- |
Source: Public Records
Mortgage History
| Date | Status | Borrower | Loan Amount |
|---|---|---|---|
| Previous Owner | Donner Kelli R | $43,260 |
Source: Public Records
Tax History Compared to Growth
Tax History
| Year | Tax Paid | Tax Assessment Tax Assessment Total Assessment is a certain percentage of the fair market value that is determined by local assessors to be the total taxable value of land and additions on the property. | Land | Improvement |
|---|---|---|---|---|
| 2024 | $2,298 | $28,751 | $5,377 | $23,374 |
| 2023 | $2,298 | $28,750 | $6,566 | $22,184 |
| 2022 | $1,631 | $19,000 | $5,178 | $13,822 |
| 2021 | $1,630 | $19,000 | $5,178 | $13,822 |
| 2020 | $1,344 | $16,597 | $5,178 | $11,419 |
| 2019 | $1,296 | $16,597 | $5,178 | $11,419 |
| 2018 | $1,213 | $14,446 | $4,507 | $9,939 |
| 2017 | $1,213 | $14,446 | $4,507 | $9,939 |
| 2016 | $1,207 | $14,083 | $2,789 | $11,294 |
| 2014 | $1,060 | $11,134 | $2,708 | $8,426 |
Source: Public Records
Map
Nearby Homes
- 12418 3rd St
- 12298 Doctor Greaves Rd
- 12424 Valley Brook Dr
- 12309 Askew St
- 4100 Duck Rd
- 12623 Fountain Lake Cir
- 4811 Martha Truman Rd
- 2900 E 119th St
- 12631 Fountain Lake Cir
- 12805 8th St
- 1202 Duck Rd
- 908 Jones Ave
- 1313 Skyline Dr
- 1321 E 126th St
- 1402 Goode Ave
- 1208 Jones Ave
- 11715 Drury Ave
- 13019 5th St
- 504 Pinkston St
- 11424 Grandview Rd
- 4297 Doctor Greaves Rd
- 4299 Doctor Greaves Rd
- 4295 Doctor Greaves Rd
- 4301 Doctor Greaves Rd
- 4291 Doctor Greaves Rd
- 4245 Doctor Greaves Rd
- 12301 Jackson Ave
- 12307 Jackson Ave
- 4210 Doctor Greaves Rd
- 4303 Doctor Greaves Rd
- 4230 Doctor Greaves Rd
- 12313 Jackson Ave
- 12319 Jackson Ave
- 4305 Doctor Greaves Rd
- 4202 Doctor Greaves Rd
- 12325 Jackson Ave
- 12306 Jackson Ave
- 12300 Jackson Ave
- 12312 Jackson Ave
- 4306 Doctor Greaves Rd