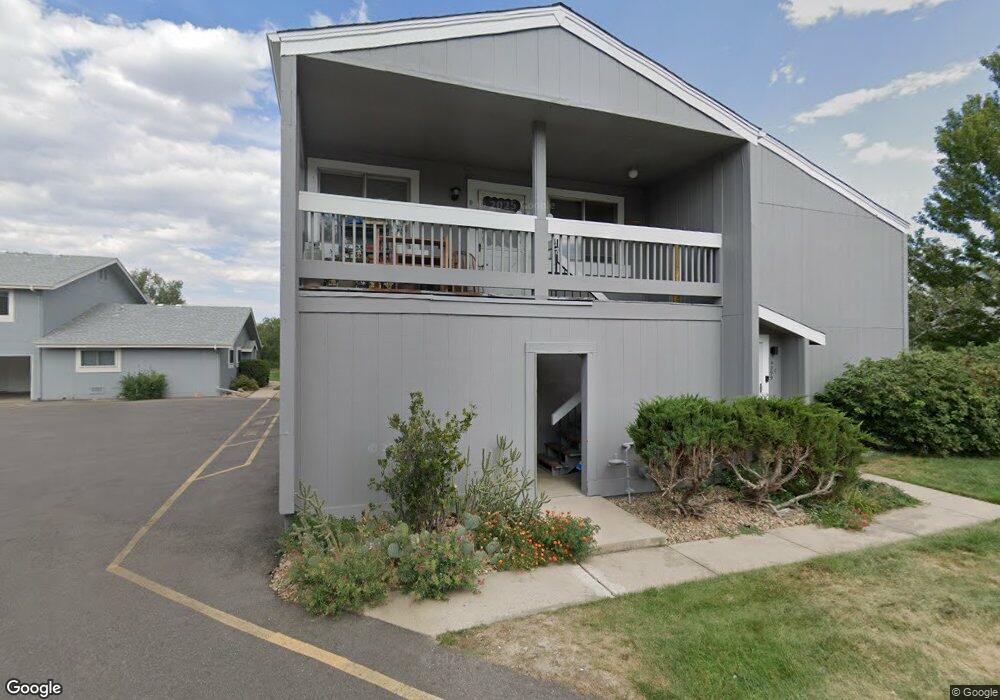
4299 Monroe Dr Unit D Boulder, CO 80303
East Aurora NeighborhoodEstimated Value: $427,654 - $514,000
2
Beds
1
Bath
968
Sq Ft
$477/Sq Ft
Est. Value
About This Home
This home is located at 4299 Monroe Dr Unit D, Boulder, CO 80303 and is currently estimated at $462,164, approximately $477 per square foot. 4299 Monroe Dr Unit D is a home located in Boulder County with nearby schools including Creekside Elementary School, Manhattan Middle School of the Arts & Academics, and Fairview High School.
Ownership History
Date
Name
Owned For
Owner Type
Purchase Details
Closed on
Sep 2, 1992
Bought by
Neff Andrew D
Current Estimated Value
Purchase Details
Closed on
May 5, 1981
Bought by
Neff Andrew D
Purchase Details
Closed on
Oct 16, 1980
Bought by
Neff Andrew D
Purchase Details
Closed on
Feb 9, 1977
Bought by
Neff Andrew D
Create a Home Valuation Report for This Property
The Home Valuation Report is an in-depth analysis detailing your home's value as well as a comparison with similar homes in the area
Home Values in the Area
Average Home Value in this Area
Purchase History
| Date | Buyer | Sale Price | Title Company |
|---|---|---|---|
| Neff Andrew D | $68,900 | -- | |
| Neff Andrew D | $60,000 | -- | |
| Neff Andrew D | -- | -- | |
| Neff Andrew D | $27,000 | -- |
Source: Public Records
Tax History
| Year | Tax Paid | Tax Assessment Tax Assessment Total Assessment is a certain percentage of the fair market value that is determined by local assessors to be the total taxable value of land and additions on the property. | Land | Improvement |
|---|---|---|---|---|
| 2025 | $2,414 | $31,575 | $10,825 | $20,750 |
| 2024 | $2,414 | $31,575 | $10,825 | $20,750 |
| 2023 | $2,372 | $27,470 | $14,264 | $16,891 |
| 2022 | $2,582 | $27,807 | $10,300 | $17,507 |
| 2021 | $2,462 | $28,607 | $10,596 | $18,011 |
| 2020 | $2,748 | $31,567 | $9,867 | $21,700 |
| 2019 | $2,706 | $31,567 | $9,867 | $21,700 |
| 2018 | $2,227 | $25,690 | $10,296 | $15,394 |
| 2017 | $2,158 | $28,401 | $11,383 | $17,018 |
| 2016 | $1,778 | $20,545 | $8,199 | $12,346 |
| 2015 | $1,684 | $16,318 | $6,925 | $9,393 |
| 2014 | $1,403 | $17,241 | $6,925 | $10,316 |
Source: Public Records
Map
Nearby Homes
- 4222 Monroe Dr Unit C
- 1180 Monroe Dr Unit B
- 875 Orman Dr
- 905 36th St
- 770 36th St
- 4415 Laguna Place Unit 201
- 5016 Forsythe Place
- 885 35th St
- 4500 Baseline Rd Unit 1208
- 4475 Laguna Place Unit 206
- 4475 Laguna Place Unit 201
- 3235 Euclid Ave
- 3161 Madison Ave Unit N302
- 3161 Madison Ave Unit 313
- 780 33rd St
- 3009 Madison Ave Unit L216
- 3009 Madison Ave Unit 105I
- 3009 Madison Ave Unit M-315
- 3000 Colorado Ave Unit B206
- 3000 Colorado Ave Unit F122
- 4299 Monroe Dr Unit C
- 4299 Monroe Dr Unit B
- 4299 Monroe Dr Unit A
- 4299 Monroe Dr
- 4289 Monroe Dr Unit D
- 4289 Monroe Dr Unit C
- 4289 Monroe Dr Unit B
- 4289 Monroe Dr Unit A
- 4300 Monroe Dr Unit D
- 4300 Monroe Dr Unit C
- 4300 Monroe Dr Unit B
- 4300 Monroe Dr Unit A
- 4269 Monroe Dr Unit D
- 4269 Monroe Dr Unit C
- 4269 Monroe Dr Unit B
- 4269 Monroe Dr Unit A
- 4269 Monroe Dr Unit 93
- 4279 Monroe Dr Unit D
- 4279 Monroe Dr Unit C
- 4279 Monroe Dr Unit B
Your Personal Tour Guide
Ask me questions while you tour the home.