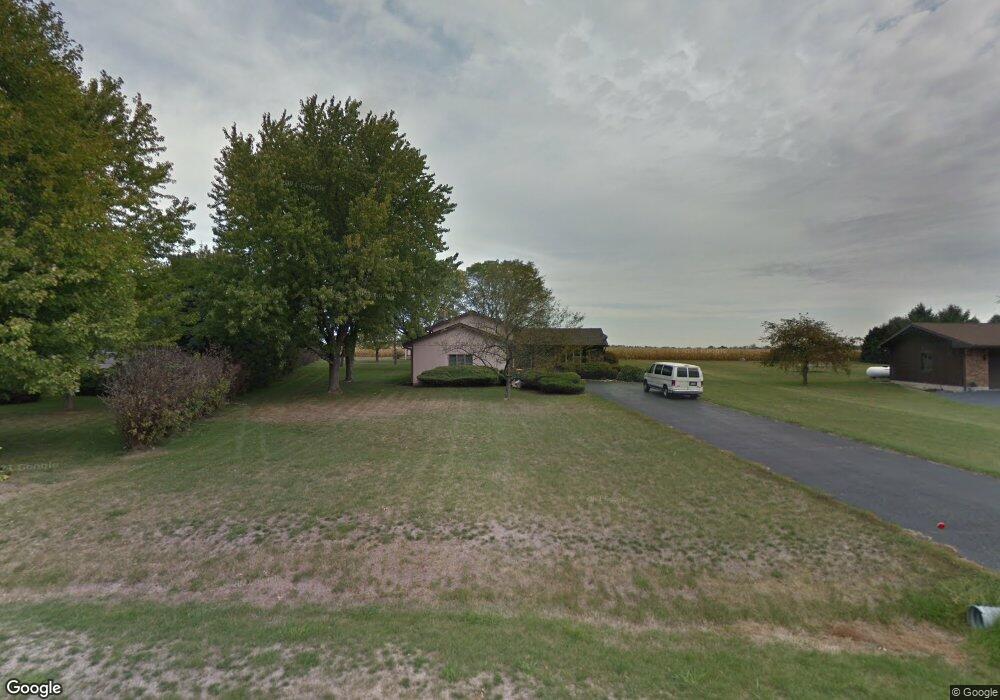
42W654 Hummingbird St Unit 2 Hampshire, IL 60140
Far West Elgin NeighborhoodEstimated Value: $426,363 - $473,000
3
Beds
3
Baths
1,800
Sq Ft
$254/Sq Ft
Est. Value
About This Home
This home is located at 42W654 Hummingbird St Unit 2, Hampshire, IL 60140 and is currently estimated at $456,341, approximately $253 per square foot. 42W654 Hummingbird St Unit 2 is a home located in Kane County with nearby schools including Howard B. Thomas Grade School, Central Middle School, and Prairie Knolls Middle School.
Ownership History
Date
Name
Owned For
Owner Type
Purchase Details
Closed on
Jan 12, 2012
Sold by
Kuras Harold K
Bought by
Garcia Antonio and Garcia Pamela
Current Estimated Value
Home Financials for this Owner
Home Financials are based on the most recent Mortgage that was taken out on this home.
Original Mortgage
$204,676
Outstanding Balance
$143,760
Interest Rate
4.5%
Mortgage Type
FHA
Estimated Equity
$312,581
Purchase Details
Closed on
Nov 27, 2010
Sold by
Kuras Virginia M
Bought by
Kuras Harold K
Purchase Details
Closed on
May 26, 1995
Sold by
Alexander Harold and Alexander Barbara
Bought by
Kuras Harold K and Kuras Brenda J
Home Financials for this Owner
Home Financials are based on the most recent Mortgage that was taken out on this home.
Original Mortgage
$115,000
Interest Rate
8.26%
Create a Home Valuation Report for This Property
The Home Valuation Report is an in-depth analysis detailing your home's value as well as a comparison with similar homes in the area
Home Values in the Area
Average Home Value in this Area
Purchase History
| Date | Buyer | Sale Price | Title Company |
|---|---|---|---|
| Garcia Antonio | $210,000 | Chicago Title Insurance Co | |
| Kuras Harold K | -- | None Available | |
| Kuras Harold K | $177,500 | -- |
Source: Public Records
Mortgage History
| Date | Status | Borrower | Loan Amount |
|---|---|---|---|
| Open | Garcia Antonio | $204,676 | |
| Previous Owner | Kuras Harold K | $115,000 |
Source: Public Records
Tax History Compared to Growth
Tax History
| Year | Tax Paid | Tax Assessment Tax Assessment Total Assessment is a certain percentage of the fair market value that is determined by local assessors to be the total taxable value of land and additions on the property. | Land | Improvement |
|---|---|---|---|---|
| 2024 | $8,263 | $113,349 | $27,638 | $85,711 |
| 2023 | $7,931 | $102,531 | $25,000 | $77,531 |
| 2022 | $6,983 | $86,533 | $23,138 | $63,395 |
| 2021 | $6,664 | $80,682 | $22,353 | $58,329 |
| 2020 | $6,672 | $79,232 | $21,951 | $57,281 |
| 2019 | $6,666 | $78,207 | $21,667 | $56,540 |
| 2018 | $6,531 | $77,074 | $20,663 | $56,411 |
| 2017 | $6,340 | $74,380 | $20,139 | $54,241 |
| 2016 | $6,708 | $72,615 | $19,661 | $52,954 |
| 2015 | -- | $70,581 | $19,661 | $50,920 |
| 2014 | -- | $65,240 | $19,661 | $45,579 |
| 2013 | -- | $67,544 | $19,997 | $47,547 |
Source: Public Records
Map
Nearby Homes
- 42W565 Hummingbird St
- 44W465 Plank Rd
- 671 Dover St
- 1740 Spinnaker St
- 1664 Ruby Dr
- 1196 Alta Vista Dr
- 2393 Alison Ave
- 2415 Bella Dr
- 2590 Bella Dr
- 1701 Windward Dr
- 2305 Aurora Dr Unit 26
- 2368 Alison Ave
- 3301 U S 20
- 1929 Diamond Head Trail
- 300 Astor Ct
- 312 Astor Ct
- 1857 Diamond Dr
- 308 Astor Ct
- 1843 Diamond Dr
- 314 Astor Ct
- 42W632 Hummingbird St
- 12N944 Hummingbird St
- 42W600 Hummingbird St
- 12N918 Hummingbird St
- 42W615 Hummingbird St
- 12N983 Meadowlark Dr
- 12N955 Meadowlark Dr
- 42W576 Hummingbird St
- 42W595 Hummingbird St
- 12N888 Hummingbird St
- 12N921 Meadowlark Dr
- 42W552 Hummingbird St
- 12N875 Hummingbird St
- 12N862 Hummingbird St
- 12N895 Meadowlark Dr
- 12N986 Meadowlark Dr Unit 3
- 42W537 Hummingbird St
- 42W636 Kiwi Ct
- 42W748 Hummingbird St
- 12N906 Meadowlark Dr