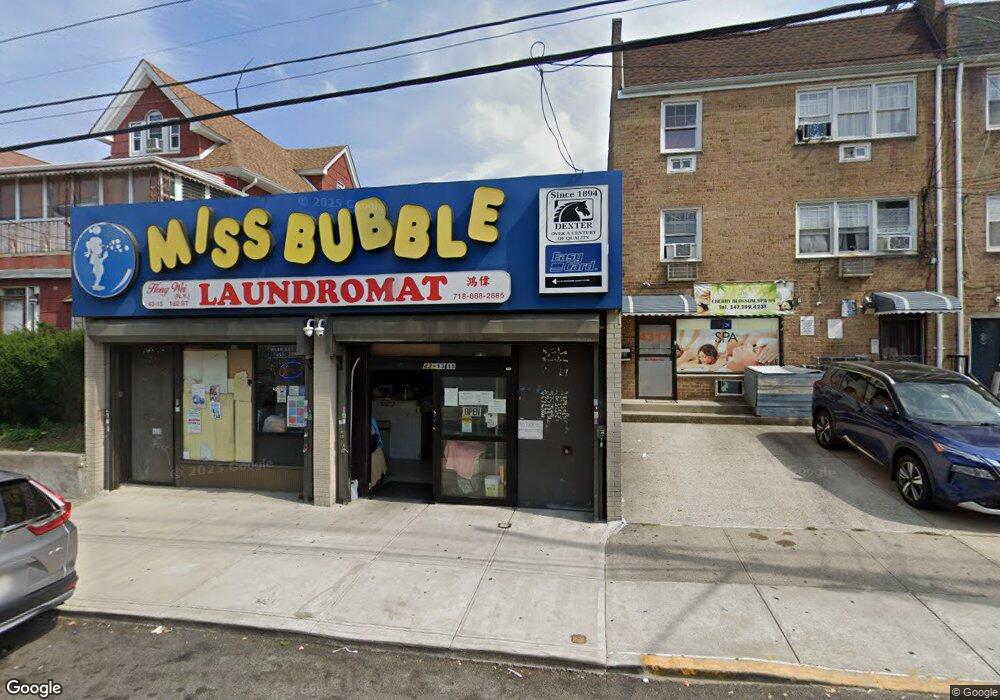
43-15 162nd St Flushing, NY 11358
Flushing NeighborhoodEstimated Value: $1,496,592
--
Bed
--
Bath
2,760
Sq Ft
$542/Sq Ft
Est. Value
About This Home
This home is located at 43-15 162nd St, Flushing, NY 11358 and is currently estimated at $1,496,592, approximately $542 per square foot. 43-15 162nd St is a home located in Queens County with nearby schools including P.S. 107 Thomas A Dooley, I.S. 25 Adrien Block, and Francis Lewis High School.
Ownership History
Date
Name
Owned For
Owner Type
Purchase Details
Closed on
Dec 14, 2005
Sold by
Tyson H Inc
Bought by
Hong Wei International Corp
Current Estimated Value
Home Financials for this Owner
Home Financials are based on the most recent Mortgage that was taken out on this home.
Original Mortgage
$637,500
Outstanding Balance
$358,801
Interest Rate
6.39%
Mortgage Type
Commercial
Estimated Equity
$1,137,791
Purchase Details
Closed on
Nov 13, 2003
Sold by
Rhk Realty Corp
Bought by
Tyson H Inc
Home Financials for this Owner
Home Financials are based on the most recent Mortgage that was taken out on this home.
Original Mortgage
$360,000
Interest Rate
6.09%
Mortgage Type
Commercial
Purchase Details
Closed on
Jul 17, 2001
Sold by
Hwang Pao-Chu
Bought by
Rhk Realty Corp
Home Financials for this Owner
Home Financials are based on the most recent Mortgage that was taken out on this home.
Original Mortgage
$266,500
Interest Rate
7.13%
Mortgage Type
Commercial
Create a Home Valuation Report for This Property
The Home Valuation Report is an in-depth analysis detailing your home's value as well as a comparison with similar homes in the area
Home Values in the Area
Average Home Value in this Area
Purchase History
| Date | Buyer | Sale Price | Title Company |
|---|---|---|---|
| Hong Wei International Corp | $850,000 | -- | |
| Tyson H Inc | $650,000 | -- | |
| Rhk Realty Corp | -- | -- |
Source: Public Records
Mortgage History
| Date | Status | Borrower | Loan Amount |
|---|---|---|---|
| Open | Hong Wei International Corp | $637,500 | |
| Previous Owner | Tyson H Inc | $360,000 | |
| Previous Owner | Rhk Realty Corp | $266,500 |
Source: Public Records
Tax History Compared to Growth
Tax History
| Year | Tax Paid | Tax Assessment Tax Assessment Total Assessment is a certain percentage of the fair market value that is determined by local assessors to be the total taxable value of land and additions on the property. | Land | Improvement |
|---|---|---|---|---|
| 2025 | $28,322 | $266,490 | $77,400 | $189,090 |
| 2024 | $28,322 | $267,390 | $77,400 | $189,990 |
| 2023 | $27,836 | $262,800 | $77,400 | $185,400 |
| 2022 | $28,119 | $271,800 | $77,400 | $194,400 |
| 2021 | $23,388 | $218,700 | $77,400 | $141,300 |
| 2020 | $27,682 | $285,300 | $77,400 | $207,900 |
| 2019 | $26,476 | $268,200 | $77,400 | $190,800 |
| 2018 | $25,530 | $242,820 | $77,400 | $165,420 |
| 2017 | $24,272 | $230,850 | $77,400 | $153,450 |
| 2016 | $22,849 | $230,850 | $77,400 | $153,450 |
| 2015 | $13,877 | $208,530 | $65,700 | $142,830 |
| 2014 | $13,877 | $198,810 | $58,536 | $140,274 |
Source: Public Records
Map
Nearby Homes
- 43-7 162nd St
- 43-24 163rd St
- 43-33 163rd St
- 4344 161st St
- 42-16 162nd St
- 43-15 164th St
- 42-6 164th St
- 163-02 45th Ave
- 45-14 161st St
- 16003 Sanford Ave
- 16001 Sanford Ave
- 45-11 160th St
- 45-35 163rd St
- 43-04 158th St Unit L2
- 43-04 158th St Unit 3E
- 4304 158th St Unit L4
- 4018 165th St
- 42-20 158th St
- 167-22 Northern Blvd
- 45-57 160th St
- 43-17 162nd St
- 4311 162nd St
- 4307 162nd St
- 43-15 162 St
- 4315 162nd St
- 4317 162nd St
- 4305 162nd St
- 43-10 162nd St Unit 1FL
- 43-10 162nd St Unit 2FL
- 4317 162nd St
- 43-23 162nd St
- 43-23 162nd St Unit 2Fl
- 43-01 162nd St
- 43-05 162nd St
- 4319 162nd St Unit 2
- 4319 162nd St
- 4319 162nd St Unit 2
- 4301 162nd St
- 43-14 162nd St
- 4306 162nd St