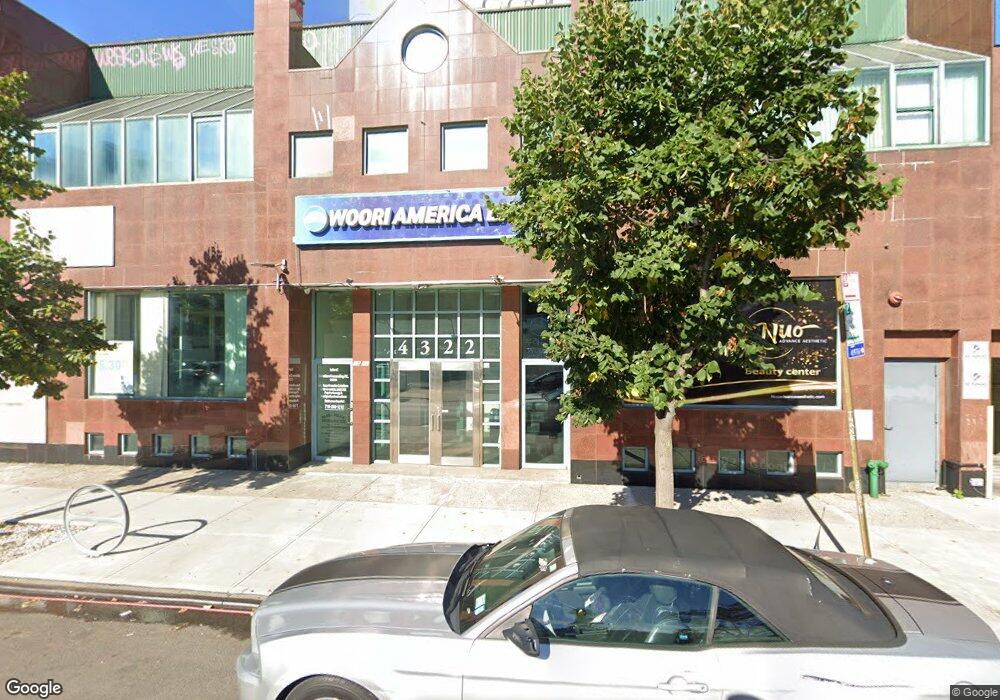
43-22 50th St Unit 1B Flushing, NY 11377
Sunnyside NeighborhoodEstimated Value: $10,195,166
--
Bed
--
Bath
16,500
Sq Ft
$618/Sq Ft
Est. Value
About This Home
This home is located at 43-22 50th St Unit 1B, Flushing, NY 11377 and is currently estimated at $10,195,166, approximately $617 per square foot. 43-22 50th St Unit 1B is a home located in Queens County with nearby schools including P.S. 150Q Sunnyside, William Cullen Bryant High School, and Razi School.
Ownership History
Date
Name
Owned For
Owner Type
Purchase Details
Closed on
Feb 24, 2014
Sold by
Main 38 Realty Inc
Bought by
Main 38 Woodside Llc
Current Estimated Value
Purchase Details
Closed on
Aug 16, 2013
Sold by
92 Yee'S Family Limited Partnership
Bought by
Main 38 Realty Inc
Home Financials for this Owner
Home Financials are based on the most recent Mortgage that was taken out on this home.
Original Mortgage
$1,500,000
Interest Rate
4.34%
Mortgage Type
Commercial
Purchase Details
Closed on
Jun 7, 2004
Sold by
50 Roosevelt Woodside Corp
Bought by
92 Yee'S Family Limited Partnership
Home Financials for this Owner
Home Financials are based on the most recent Mortgage that was taken out on this home.
Original Mortgage
$410,063
Interest Rate
6.12%
Mortgage Type
Commercial
Create a Home Valuation Report for This Property
The Home Valuation Report is an in-depth analysis detailing your home's value as well as a comparison with similar homes in the area
Home Values in the Area
Average Home Value in this Area
Purchase History
| Date | Buyer | Sale Price | Title Company |
|---|---|---|---|
| Main 38 Woodside Llc | -- | -- | |
| Main 38 Realty Inc | $6,000,000 | -- | |
| 92 Yee'S Family Limited Partnership | $3,530,000 | -- |
Source: Public Records
Mortgage History
| Date | Status | Borrower | Loan Amount |
|---|---|---|---|
| Previous Owner | Main 38 Realty Inc | $1,500,000 | |
| Previous Owner | 92 Yee'S Family Limited Partnership | $410,063 |
Source: Public Records
Tax History Compared to Growth
Tax History
| Year | Tax Paid | Tax Assessment Tax Assessment Total Assessment is a certain percentage of the fair market value that is determined by local assessors to be the total taxable value of land and additions on the property. | Land | Improvement |
|---|---|---|---|---|
| 2025 | $165,718 | $1,585,890 | $185,850 | $1,400,040 |
| 2024 | $165,718 | $1,564,560 | $185,850 | $1,378,710 |
| 2023 | $163,039 | $1,539,270 | $185,850 | $1,353,420 |
| 2022 | $158,492 | $1,515,600 | $185,850 | $1,329,750 |
| 2021 | $142,348 | $1,331,100 | $185,850 | $1,145,250 |
| 2020 | $149,684 | $1,552,500 | $185,850 | $1,366,650 |
| 2019 | $139,659 | $1,530,900 | $185,850 | $1,345,050 |
| 2018 | $128,029 | $1,217,701 | $185,850 | $1,031,851 |
| 2017 | $117,734 | $1,119,781 | $185,850 | $933,931 |
| 2016 | $108,061 | $1,119,781 | $185,850 | $933,931 |
| 2015 | $47,370 | $995,851 | $185,850 | $810,001 |
| 2014 | $47,370 | $961,201 | $185,850 | $775,351 |
Source: Public Records
Map
Nearby Homes
- 49-07 43rd Ave Unit 7 F
- 43-33 48th St Unit 6 A
- 43-33 48th St Unit 6D
- 43-33 48th St Unit A
- 43-33 48th St Unit 4J
- 4333 48th St Unit 1B
- 4333 48th St Unit 3B
- 4333 48th St Unit 4H
- 4333 48th St Unit 4A
- 4333 48th St Unit 1A
- 4333 48th St Unit 2B
- 4333 48th St Unit 4E
- 4333 48th St Unit 5A
- 4333 48th St Unit 3C
- 5005 43rd Ave Unit 5H
- 43-07 48th St Unit 5B
- 43-07 48th St Unit 5A
- 41-43 49th St
- 4330 52nd St Unit 4A
- 43-30 52nd St Unit 2A
- 4322 50th St Unit 2D, 2E
- 4322 50th St
- 43-22 50 St
- 43-22 50th St
- 4913 Roosevelt Ave
- 43-17 49th St
- 4312 50th St
- 4317 49th St
- 4321 49th St
- 4325 49th St
- 4325 49th St Unit 4B
- 4311 49th St
- 40-09 Roosevelt Ave
- 4905 Roosevelt Ave
- 4915 Roosevelt Ave
- 4916 43rd Ave
- 4918 43rd Ave
- 4914 43rd Ave
- 4920 43rd Ave Unit 2 floor
- 4920 43rd Ave