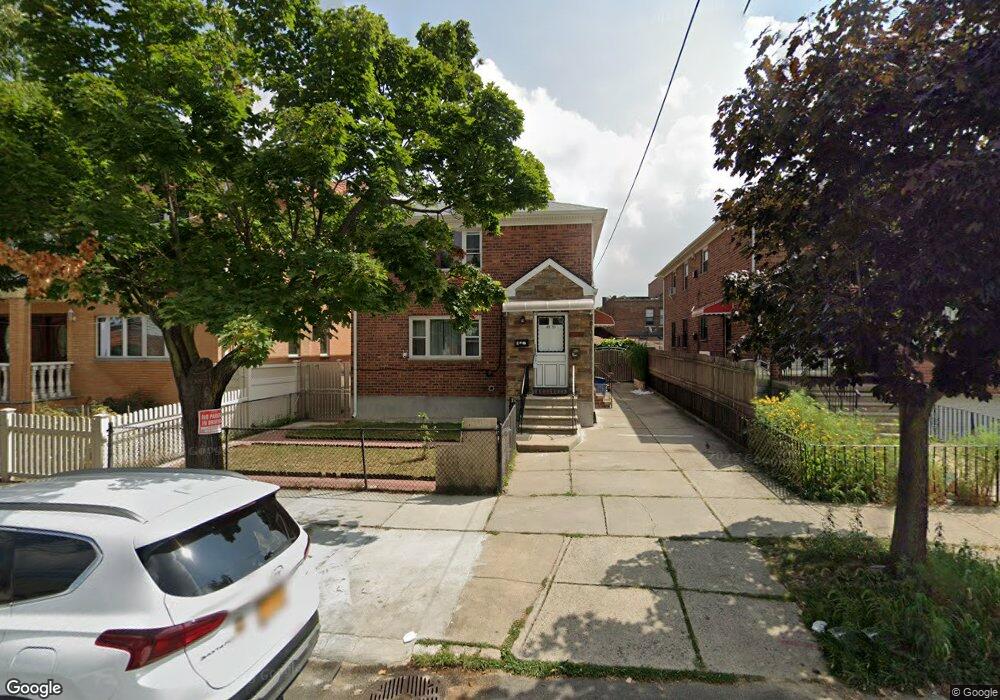
43-35 159th St Unit Building Flushing, NY 11358
Flushing NeighborhoodEstimated Value: $1,304,128 - $1,728,000
--
Bed
3
Baths
2,208
Sq Ft
$694/Sq Ft
Est. Value
About This Home
This home is located at 43-35 159th St Unit Building, Flushing, NY 11358 and is currently estimated at $1,531,532, approximately $693 per square foot. 43-35 159th St Unit Building is a home located in Queens County with nearby schools including P.S. 22 - Thomas Jefferson, I.S. 25 Adrien Block, and Francis Lewis High School.
Ownership History
Date
Name
Owned For
Owner Type
Purchase Details
Closed on
Jun 9, 2020
Sold by
Papes Victoria and Papes-Jobsky Christine
Bought by
Cyqo Investco Llc
Current Estimated Value
Home Financials for this Owner
Home Financials are based on the most recent Mortgage that was taken out on this home.
Original Mortgage
$350,000
Outstanding Balance
$308,874
Interest Rate
3.2%
Mortgage Type
New Conventional
Estimated Equity
$1,222,658
Purchase Details
Closed on
Apr 11, 2013
Sold by
Bertha Papes Living Trust Dtd /2003 and Christine Papes-Jobsky Co-Trustee
Bought by
Papes Victoria and Papes-Jobsky Christine
Purchase Details
Closed on
May 29, 2003
Sold by
Bertha Papes
Bought by
Bertha Papes Living Trust Dated May 29 and Papes
Create a Home Valuation Report for This Property
The Home Valuation Report is an in-depth analysis detailing your home's value as well as a comparison with similar homes in the area
Home Values in the Area
Average Home Value in this Area
Purchase History
| Date | Buyer | Sale Price | Title Company |
|---|---|---|---|
| Cyqo Investco Llc | $1,450,000 | -- | |
| Cyqo Investco Llc | $1,450,000 | -- | |
| Cyqo Investco Llc | $1,450,000 | -- | |
| Papes Victoria | -- | -- | |
| Papes Victoria | -- | -- | |
| Bertha Papes Living Trust Dated May 29 | -- | -- | |
| Bertha Papes Living Trust Dated May 29 | -- | -- |
Source: Public Records
Mortgage History
| Date | Status | Borrower | Loan Amount |
|---|---|---|---|
| Open | Cyqo Investco Llc | $350,000 | |
| Closed | Cyqo Investco Llc | $350,000 |
Source: Public Records
Tax History Compared to Growth
Tax History
| Year | Tax Paid | Tax Assessment Tax Assessment Total Assessment is a certain percentage of the fair market value that is determined by local assessors to be the total taxable value of land and additions on the property. | Land | Improvement |
|---|---|---|---|---|
| 2025 | $11,850 | $58,999 | $17,123 | $41,876 |
| 2024 | $11,850 | $58,999 | $18,606 | $40,393 |
| 2023 | $11,442 | $56,970 | $15,166 | $41,804 |
| 2022 | $10,729 | $77,520 | $23,160 | $54,360 |
| 2021 | $10,968 | $71,700 | $23,160 | $48,540 |
| 2020 | $9,748 | $78,840 | $23,160 | $55,680 |
| 2019 | $9,626 | $76,860 | $23,160 | $53,700 |
| 2018 | $9,019 | $47,475 | $15,120 | $32,355 |
| 2017 | $8,484 | $44,788 | $15,745 | $29,043 |
| 2016 | $3,720 | $44,788 | $15,745 | $29,043 |
| 2015 | -- | $40,972 | $19,189 | $21,783 |
| 2014 | -- | $40,972 | $21,357 | $19,615 |
Source: Public Records
Map
Nearby Homes
- 4344 161st St
- 43-04 158th St Unit L2
- 43-04 158th St Unit 3E
- 4304 158th St Unit L4
- 45-11 160th St
- 45-14 161st St
- 43-7 162nd St
- 43-23 156th St
- 45-11 157th St
- 42-60 157th St Unit 3D
- 43-24 163rd St
- 42-20 158th St
- 42-16 162nd St
- 43-33 163rd St
- 45-57 160th St
- 16001 Sanford Ave
- 16003 Sanford Ave
- 163-02 45th Ave
- 42-36 156th St
- 45-57 157th St
- 43-35 159th St
- 4335 159th St
- 4331 159th St Unit 1
- 4331 159th St Unit 1Fl
- 4339 159th St
- 4331 159th St
- 4339 159th St
- 4339 159th St
- 43-27 159th St
- 43-27 159th St Unit 2Fl
- 4345 159th St
- 4327 159th St
- 4338 160th St
- 4336 160th St
- 4340 160th St
- 4332 160th St
- 43-47 159th St
- 4347 159th St
- 43-47 159th St Unit 2Fl