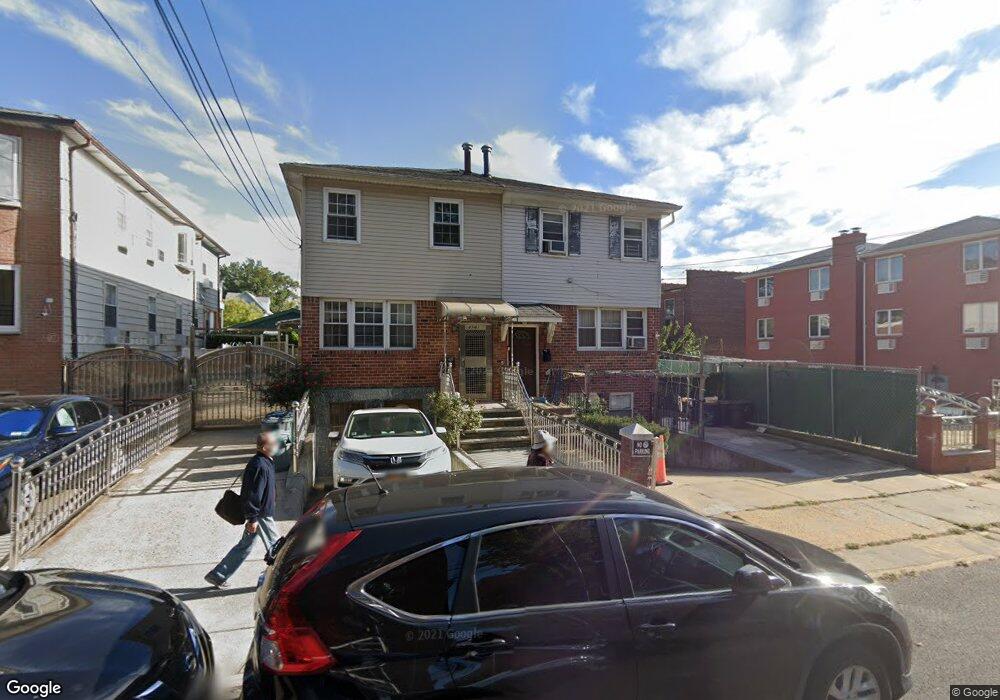
43-63 Robinson St Unit 2B Flushing, NY 11355
Flushing-Willets Point NeighborhoodEstimated Value: $1,209,741 - $1,597,000
Studio
1
Bath
1,690
Sq Ft
$837/Sq Ft
Est. Value
About This Home
This home is located at 43-63 Robinson St Unit 2B, Flushing, NY 11355 and is currently estimated at $1,414,935, approximately $837 per square foot. 43-63 Robinson St Unit 2B is a home located in Queens County with nearby schools including P.S. 024 Andrew Jackson School, Rachel Carson I.S. 237Q, and John Bowne High School.
Ownership History
Date
Name
Owned For
Owner Type
Purchase Details
Closed on
Aug 1, 2005
Sold by
Pan Xue Feng
Bought by
Wu Chi Shu and Ye Chun Yan
Current Estimated Value
Home Financials for this Owner
Home Financials are based on the most recent Mortgage that was taken out on this home.
Original Mortgage
$300,000
Outstanding Balance
$156,377
Interest Rate
5.54%
Mortgage Type
Purchase Money Mortgage
Estimated Equity
$1,258,558
Purchase Details
Closed on
Oct 31, 2002
Sold by
Lee Lai Fan
Bought by
Pan Xue Feng
Home Financials for this Owner
Home Financials are based on the most recent Mortgage that was taken out on this home.
Original Mortgage
$337,500
Interest Rate
6.03%
Purchase Details
Closed on
Apr 22, 2002
Sold by
Kong David S and Kong Yuen C
Bought by
Lee Lai Fan
Home Financials for this Owner
Home Financials are based on the most recent Mortgage that was taken out on this home.
Original Mortgage
$242,000
Interest Rate
7%
Purchase Details
Closed on
Aug 9, 1995
Sold by
Ufh Apartments Inc
Bought by
Ma Timothy Ying Lin and Hsu Shu Hua
Create a Home Valuation Report for This Property
The Home Valuation Report is an in-depth analysis detailing your home's value as well as a comparison with similar homes in the area
Home Values in the Area
Average Home Value in this Area
Purchase History
| Date | Buyer | Sale Price | Title Company |
|---|---|---|---|
| Wu Chi Shu | $610,000 | -- | |
| Pan Xue Feng | -- | -- | |
| Lee Lai Fan | -- | -- | |
| Ma Timothy Ying Lin | $40,000 | -- |
Source: Public Records
Mortgage History
| Date | Status | Borrower | Loan Amount |
|---|---|---|---|
| Open | Wu Chi Shu | $300,000 | |
| Previous Owner | Pan Xue Feng | $337,500 | |
| Previous Owner | Lee Lai Fan | $242,000 |
Source: Public Records
Tax History
| Year | Tax Paid | Tax Assessment Tax Assessment Total Assessment is a certain percentage of the fair market value that is determined by local assessors to be the total taxable value of land and additions on the property. | Land | Improvement |
|---|---|---|---|---|
| 2025 | $9,668 | $52,104 | $9,932 | $42,172 |
| 2024 | $9,680 | $49,537 | $9,141 | $40,396 |
| 2023 | $9,668 | $49,537 | $10,045 | $39,492 |
| 2022 | $9,313 | $77,100 | $14,880 | $62,220 |
| 2021 | $9,319 | $69,300 | $14,880 | $54,420 |
| 2020 | $8,895 | $64,320 | $14,880 | $49,440 |
| 2019 | $8,343 | $57,000 | $14,880 | $42,120 |
| 2018 | $8,117 | $41,281 | $11,189 | $30,092 |
| 2017 | $7,870 | $40,075 | $10,779 | $29,296 |
| 2016 | $7,301 | $40,075 | $10,779 | $29,296 |
| 2015 | $4,340 | $36,183 | $10,568 | $25,615 |
| 2014 | $4,340 | $34,401 | $11,958 | $22,443 |
Source: Public Records
Map
Nearby Homes
- 142-03 45th Ave
- 44-69 Kissena Blvd Unit 4M
- 44-59 Kissena Blvd Unit 4J
- 45-30 Smart St
- 43-35 Union St Unit 2G
- 43-18 Robinson St Unit 7D
- 4317 Union St Unit 6E
- 4317 Union St Unit 2B
- 43-17 Union St Unit 8-B
- 43-17 Union St Unit 6C
- 43-20 Union St Unit 6D
- 4334 Union St Unit 5H
- 44-55 Kissena Blvd Unit 3B
- 141-18 Cherry Ave Unit Parking
- 45-24 Burling St
- 140-32 Cherry Ave Unit 5D
- 140-26 Cherry Ave Unit 5D
- 31-16 Union St
- 14026 Cherry Ave Unit 5C
- 141-15 Cherry Ave Unit 5C
- 4363 Robinson St
- 4361 Robinson St
- 4359 Robinson St
- 142-05 45th Ave Unit 1
- 14205 45th Ave Unit 3FL
- 14205 45th Ave Unit 2FL
- 14205 45th Ave
- 4357 Robinson St
- 14203 45th Ave
- 142-9 45th Ave
- 14203 45th Ave
- 14203 45th Ave Unit 1FL
- 14203 45th Ave Unit 1st Fl
- 142-03 45th Ave Unit 1st Fl
- 14203 45th Ave
- 14203 45th Ave Unit 6
- 43-53 Robinson St
- 4364 Bowne St
- 4360 Bowne St
- 43-64 Bowne St
Your Personal Tour Guide
Ask me questions while you tour the home.