Estimated Value: $391,000 - $450,000
2
Beds
2
Baths
1,557
Sq Ft
$275/Sq Ft
Est. Value
About This Home
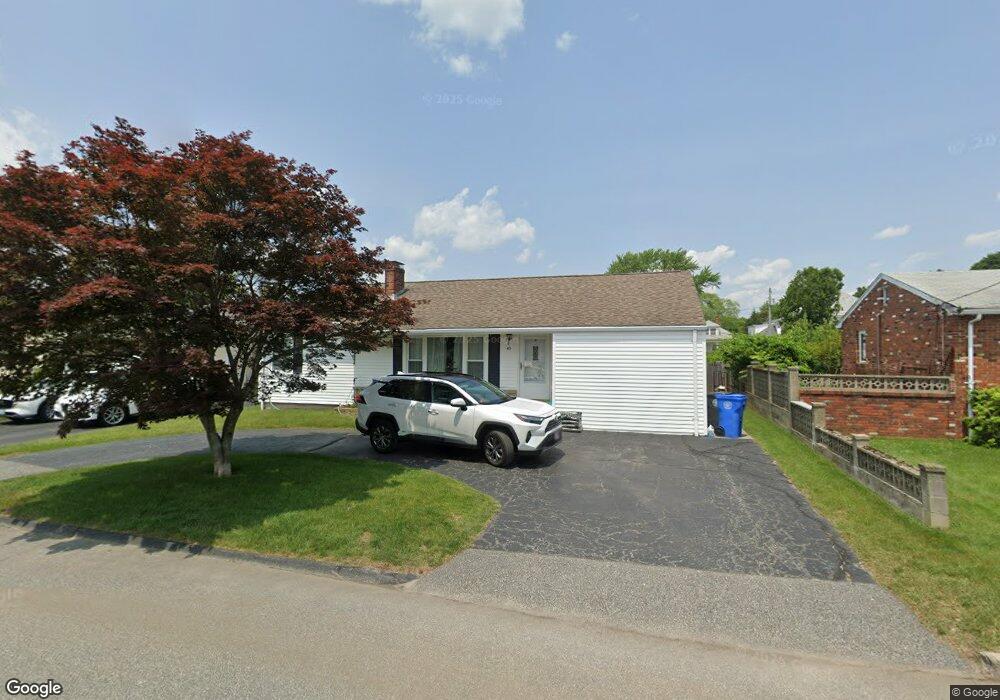
This home is located at 43 A St, Cranston, RI 02920 and is currently estimated at $428,338, approximately $275 per square foot. 43 A St is a home located in Providence County with nearby schools including George J. Peters School, Western Hills Middle School, and Cranston High School West.
Ownership History
Date
Name
Owned For
Owner Type
Purchase Details
Closed on
Jan 18, 2017
Sold by
Ferranti Michael and Ferranti Marie A
Bought by
Nardolillo Catherine A and Nardolillo David M
Current Estimated Value
Home Financials for this Owner
Home Financials are based on the most recent Mortgage that was taken out on this home.
Original Mortgage
$185,000
Outstanding Balance
$152,500
Interest Rate
4.13%
Mortgage Type
Purchase Money Mortgage
Estimated Equity
$275,838
Purchase Details
Closed on
Nov 4, 1998
Sold by
Litter Robert J and Jensen George W
Bought by
Fleet National Bank
Create a Home Valuation Report for This Property
The Home Valuation Report is an in-depth analysis detailing your home's value as well as a comparison with similar homes in the area
Home Values in the Area
Average Home Value in this Area
Purchase History
| Date | Buyer | Sale Price | Title Company |
|---|---|---|---|
| Nardolillo Catherine A | $195,000 | -- | |
| Fleet National Bank | $29,000 | -- |
Source: Public Records
Mortgage History
| Date | Status | Borrower | Loan Amount |
|---|---|---|---|
| Open | Fleet National Bank | $185,000 |
Source: Public Records
Tax History
| Year | Tax Paid | Tax Assessment Tax Assessment Total Assessment is a certain percentage of the fair market value that is determined by local assessors to be the total taxable value of land and additions on the property. | Land | Improvement |
|---|---|---|---|---|
| 2025 | $4,598 | $331,300 | $98,900 | $232,400 |
| 2024 | $4,509 | $331,300 | $98,900 | $232,400 |
| 2023 | $4,534 | $239,900 | $68,200 | $171,700 |
| 2022 | $4,441 | $239,900 | $68,200 | $171,700 |
| 2021 | $4,318 | $239,900 | $68,200 | $171,700 |
| 2020 | $4,233 | $203,800 | $64,800 | $139,000 |
| 2019 | $4,233 | $203,800 | $64,800 | $139,000 |
| 2018 | $4,135 | $203,800 | $64,800 | $139,000 |
| 2017 | $3,760 | $163,900 | $47,800 | $116,100 |
| 2016 | $3,680 | $163,900 | $47,800 | $116,100 |
| 2015 | $3,680 | $163,900 | $47,800 | $116,100 |
| 2014 | $3,049 | $157,000 | $47,800 | $109,200 |
Source: Public Records
Map
Nearby Homes
- 210 Hyde St
- 129 Vallette St
- 99 Salem Ave
- 54 Randall St
- 80 W View Ave
- 19 Salem Ave
- 00 Burton St
- 14 New Hampshire St
- 333 Phenix Ave
- 47 Bretton Woods Dr
- 321 Budlong Rd
- 135 Meshanticut Valley Pkwy
- 15 Vallone Rd
- 9 Southern St
- 93 Elena St
- 38 Baldino Dr
- 46 Roslyn Ave
- 141 Glen Ridge Rd
- 7 Maple St
- 214 Meshanticut Valley Pkwy
Your Personal Tour Guide
Ask me questions while you tour the home.