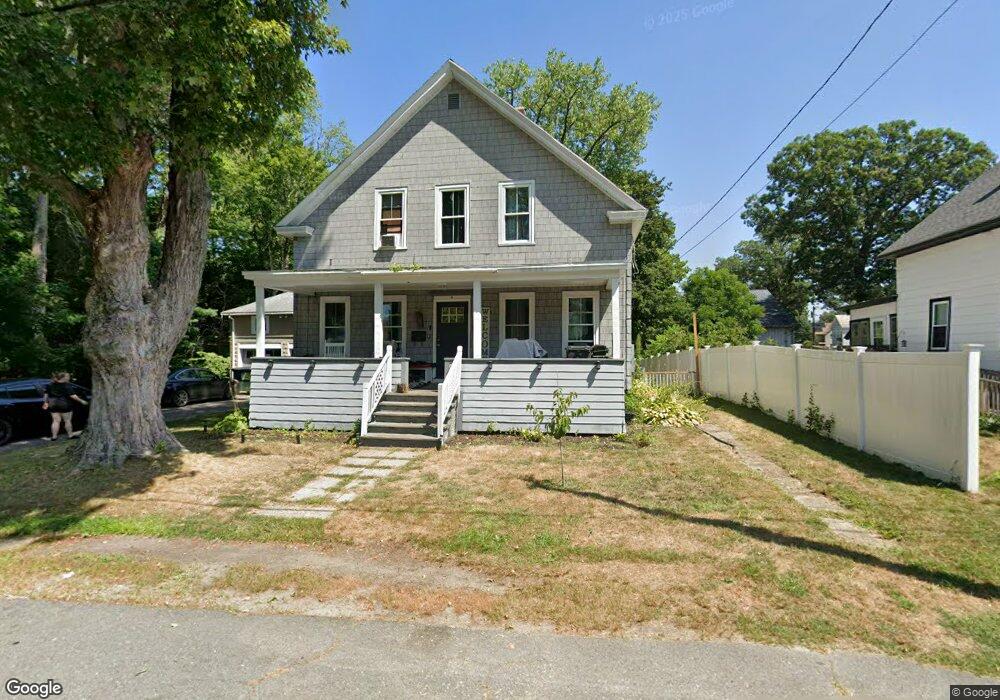
43 Adams St Orange, MA 01364
Estimated Value: $211,000 - $327,000
4
Beds
1
Bath
1,313
Sq Ft
$203/Sq Ft
Est. Value
About This Home
This home is located at 43 Adams St, Orange, MA 01364 and is currently estimated at $266,916, approximately $203 per square foot. 43 Adams St is a home located in Franklin County with nearby schools including Fisher Hill and Ralph C Mahar Regional School.
Ownership History
Date
Name
Owned For
Owner Type
Purchase Details
Closed on
Apr 26, 2021
Sold by
Cardona Elizabeth A
Bought by
Cardona Elizabeth A and Garny Paul
Current Estimated Value
Purchase Details
Closed on
Aug 23, 2017
Sold by
Baldic Richard E Est
Bought by
Cardona Elizabeth A
Home Financials for this Owner
Home Financials are based on the most recent Mortgage that was taken out on this home.
Original Mortgage
$43,000
Interest Rate
3.38%
Mortgage Type
New Conventional
Create a Home Valuation Report for This Property
The Home Valuation Report is an in-depth analysis detailing your home's value as well as a comparison with similar homes in the area
Home Values in the Area
Average Home Value in this Area
Purchase History
| Date | Buyer | Sale Price | Title Company |
|---|---|---|---|
| Cardona Elizabeth A | -- | None Available | |
| Cardona Elizabeth A | $103,000 | -- |
Source: Public Records
Mortgage History
| Date | Status | Borrower | Loan Amount |
|---|---|---|---|
| Previous Owner | Cardona Elizabeth A | $43,000 |
Source: Public Records
Tax History
| Year | Tax Paid | Tax Assessment Tax Assessment Total Assessment is a certain percentage of the fair market value that is determined by local assessors to be the total taxable value of land and additions on the property. | Land | Improvement |
|---|---|---|---|---|
| 2025 | $36 | $217,800 | $24,500 | $193,300 |
| 2024 | $3,500 | $200,700 | $24,500 | $176,200 |
| 2023 | $3,147 | $175,200 | $24,500 | $150,700 |
| 2022 | $2,828 | $147,900 | $22,000 | $125,900 |
| 2021 | $2,861 | $142,700 | $42,400 | $100,300 |
| 2020 | $2,728 | $134,200 | $38,700 | $95,500 |
| 2019 | $2,691 | $119,500 | $33,500 | $86,000 |
| 2018 | $2,413 | $110,000 | $31,200 | $78,800 |
| 2017 | $2,335 | $110,000 | $31,200 | $78,800 |
| 2016 | $2,196 | $101,200 | $27,900 | $73,300 |
| 2015 | $2,110 | $101,600 | $29,800 | $71,800 |
| 2014 | $2,148 | $108,800 | $29,800 | $79,000 |
Source: Public Records
Map
Nearby Homes
- 58 E Main St
- 50 E Main St
- 12-14 E Main St
- 270 S Main St
- 83 W Main St
- 36 Summit St Unit A
- 36 Summit St Unit B
- 23 E Howe St
- 35 Ball St
- 166-168 W Main St
- 222 W River St
- 30 Cottage St
- 313-315 Walnut Hill Rd
- 39 Terrace St
- 56 Shelter St
- 490 S Main St
- 00 S Main St
- 000 S Main St
- 549 E Main St
- 0 Quabbin Blvd
Your Personal Tour Guide
Ask me questions while you tour the home.