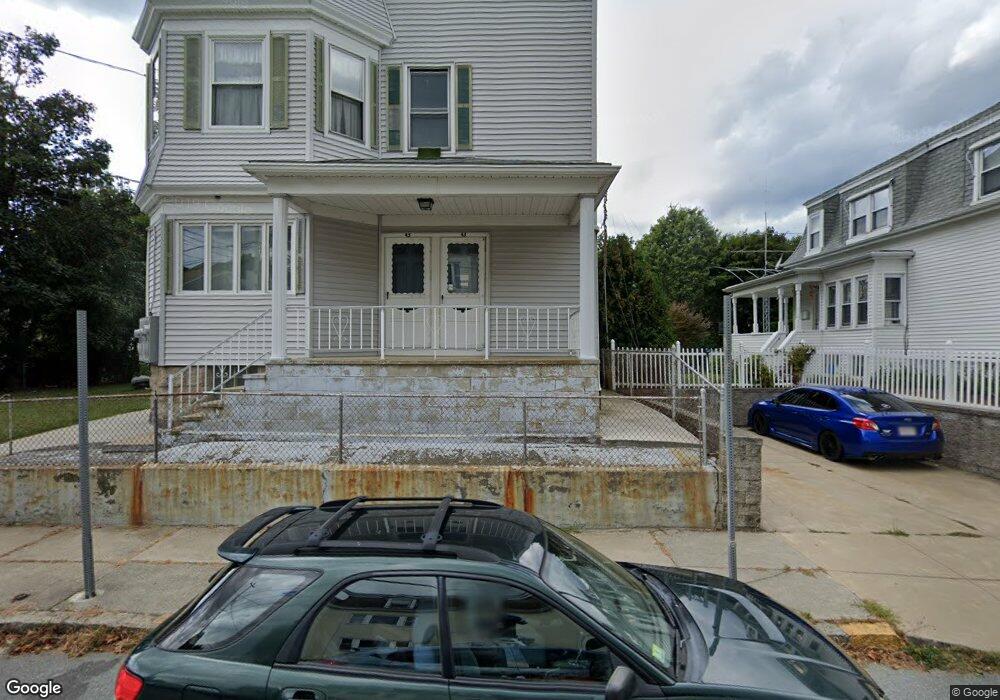
43 Ash St Fall River, MA 02724
Sandy Beach NeighborhoodEstimated Value: $711,000 - $755,000
9
Beds
3
Baths
4,158
Sq Ft
$178/Sq Ft
Est. Value
About This Home
This home is located at 43 Ash St, Fall River, MA 02724 and is currently estimated at $740,000, approximately $177 per square foot. 43 Ash St is a home located in Bristol County with nearby schools including Carlton M. Viveiros Elementary School, Matthew J. Kuss Middle School, and B M C Durfee High School.
Ownership History
Date
Name
Owned For
Owner Type
Purchase Details
Closed on
Nov 28, 2017
Sold by
Oliveira Paula and Oliveira Kimberly Pamela
Bought by
Oliveira Glenn J and Oliveira Paula
Current Estimated Value
Home Financials for this Owner
Home Financials are based on the most recent Mortgage that was taken out on this home.
Original Mortgage
$236,000
Outstanding Balance
$196,658
Interest Rate
3.91%
Mortgage Type
New Conventional
Estimated Equity
$543,342
Purchase Details
Closed on
Apr 15, 2010
Sold by
Silva Everett and Silva Arline
Bought by
Silva Everett and Silva Arline
Create a Home Valuation Report for This Property
The Home Valuation Report is an in-depth analysis detailing your home's value as well as a comparison with similar homes in the area
Home Values in the Area
Average Home Value in this Area
Purchase History
| Date | Buyer | Sale Price | Title Company |
|---|---|---|---|
| Oliveira Glenn J | $55,567 | -- | |
| Silva Everett | -- | -- |
Source: Public Records
Mortgage History
| Date | Status | Borrower | Loan Amount |
|---|---|---|---|
| Open | Oliveira Glenn J | $236,000 |
Source: Public Records
Tax History
| Year | Tax Paid | Tax Assessment Tax Assessment Total Assessment is a certain percentage of the fair market value that is determined by local assessors to be the total taxable value of land and additions on the property. | Land | Improvement |
|---|---|---|---|---|
| 2025 | $6,523 | $569,700 | $110,600 | $459,100 |
| 2024 | $6,237 | $542,800 | $106,500 | $436,300 |
| 2023 | $5,540 | $451,500 | $88,000 | $363,500 |
| 2022 | $4,899 | $388,200 | $83,800 | $304,400 |
| 2021 | $4,604 | $332,900 | $79,700 | $253,200 |
| 2020 | $4,111 | $284,500 | $78,600 | $205,900 |
| 2019 | $3,479 | $238,600 | $75,600 | $163,000 |
| 2018 | $3,330 | $227,800 | $81,900 | $145,900 |
| 2017 | $3,136 | $224,000 | $78,100 | $145,900 |
| 2016 | $3,069 | $225,200 | $83,100 | $142,100 |
| 2015 | $2,946 | $225,200 | $83,100 | $142,100 |
| 2014 | $2,979 | $236,800 | $80,700 | $156,100 |
Source: Public Records
Map
Nearby Homes
- 70 Brown St
- 700 Shore Dr Unit 6-604
- 700 Shore Dr Unit 1205
- 700 Shore Dr Unit 810
- 420 Bradford Ave
- 303 Eagle St Unit C
- 403 Division St Unit 13
- 403 Division St Unit 5
- 403 Division St Unit 9
- 403 Division St Unit 11
- 403 Division St Unit 12
- 403 Division St Unit 1
- 403 Division St Unit 18
- 20 Wilcox St
- 1273-1279 S Main St
- 334 Fountain St
- 315 William St
- 327 William St
- 1334 S Main St
- 330 William St
Your Personal Tour Guide
Ask me questions while you tour the home.