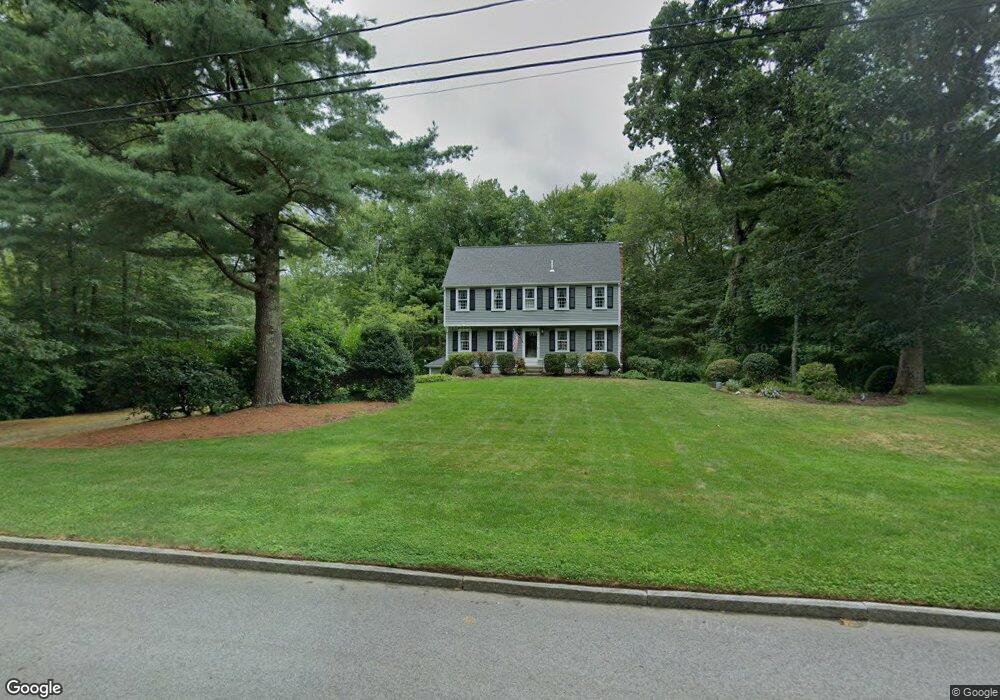
43 Bailey Rd Hanover, MA 02339
Estimated Value: $694,000 - $827,000
3
Beds
3
Baths
1,591
Sq Ft
$472/Sq Ft
Est. Value
About This Home
This home is located at 43 Bailey Rd, Hanover, MA 02339 and is currently estimated at $750,366, approximately $471 per square foot. 43 Bailey Rd is a home located in Plymouth County with nearby schools including Hanover High School, Cadence Academy Preschool - Hanover, and The Master's Academy.
Ownership History
Date
Name
Owned For
Owner Type
Purchase Details
Closed on
Jul 3, 2024
Sold by
Finneran Lawrence W and Finneran Linda M
Bought by
Finneran Lawrence W
Current Estimated Value
Purchase Details
Closed on
May 30, 1985
Bought by
Finneran Lawrence W and Finneran Linda
Create a Home Valuation Report for This Property
The Home Valuation Report is an in-depth analysis detailing your home's value as well as a comparison with similar homes in the area
Home Values in the Area
Average Home Value in this Area
Purchase History
| Date | Buyer | Sale Price | Title Company |
|---|---|---|---|
| Finneran Lawrence W | -- | None Available | |
| Finneran Lawrence W | -- | None Available | |
| Finneran Lawrence W | $162,000 | -- |
Source: Public Records
Mortgage History
| Date | Status | Borrower | Loan Amount |
|---|---|---|---|
| Previous Owner | Finneran Lawrence W | $92,500 | |
| Previous Owner | Finneran Lawrence W | $113,500 | |
| Previous Owner | Finneran Lawrence W | $122,000 |
Source: Public Records
Tax History
| Year | Tax Paid | Tax Assessment Tax Assessment Total Assessment is a certain percentage of the fair market value that is determined by local assessors to be the total taxable value of land and additions on the property. | Land | Improvement |
|---|---|---|---|---|
| 2025 | $8,468 | $685,700 | $271,800 | $413,900 |
| 2024 | $8,291 | $645,700 | $271,800 | $373,900 |
| 2023 | $7,685 | $569,700 | $247,000 | $322,700 |
| 2022 | $7,826 | $513,200 | $247,000 | $266,200 |
| 2021 | $4,616 | $470,900 | $224,900 | $246,000 |
| 2020 | $7,504 | $460,100 | $224,900 | $235,200 |
| 2019 | $4,457 | $445,100 | $224,900 | $220,200 |
| 2018 | $4,352 | $430,800 | $224,900 | $205,900 |
| 2017 | $5,842 | $431,700 | $214,100 | $217,600 |
| 2016 | $6,867 | $407,300 | $194,500 | $212,800 |
| 2015 | $6,578 | $407,300 | $194,500 | $212,800 |
Source: Public Records
Map
Nearby Homes
- 506 Main St
- 44 Stone Meadow Ln
- 47 Stone Meadow Ln
- 776 Main St
- 62 Larchmont Ln
- 36 Bayberry Ln
- 561 Circuit St
- 73 Shingle Mill Ln
- 53 Chestnut St
- 36 Grove St
- 535 Webster St
- 75 School St
- 46 Brookwood Rd
- 250 Center St
- 823 Market St
- 50 Village Ln
- 51 Cervelli Farm Dr
- 37 Dr
- 23 Cervelli Farm Dr
- 38 Cervelli Farm Dr
Your Personal Tour Guide
Ask me questions while you tour the home.