Estimated Value: $863,244 - $1,574,000
--
Bed
--
Bath
4,022
Sq Ft
$276/Sq Ft
Est. Value
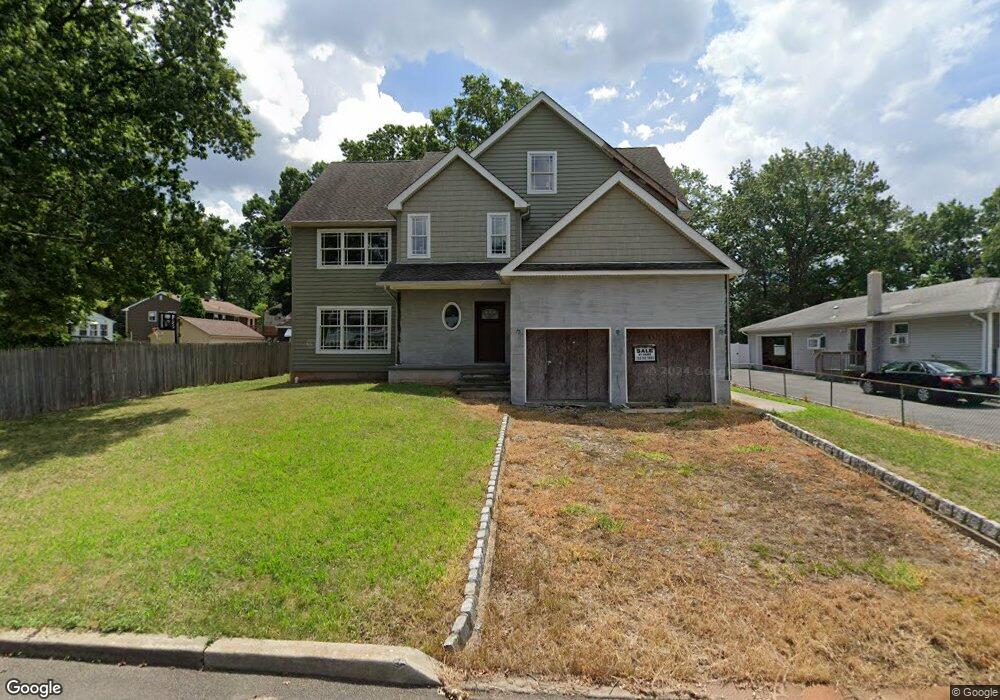
About This Home
This home is located at 43 Bennet St, Fords, NJ 08863 and is currently estimated at $1,108,811, approximately $275 per square foot. 43 Bennet St is a home with nearby schools including Ford Avenue Elementary School, Fords Middle School, and Woodbridge High School.
Ownership History
Date
Name
Owned For
Owner Type
Purchase Details
Closed on
Aug 30, 2022
Sold by
Goldish and Patricia
Bought by
Rajamanickam Sivasankaran C and Paranthagan Dhana Shanmuga
Current Estimated Value
Home Financials for this Owner
Home Financials are based on the most recent Mortgage that was taken out on this home.
Original Mortgage
$647,200
Outstanding Balance
$618,571
Interest Rate
5.3%
Mortgage Type
New Conventional
Estimated Equity
$490,240
Purchase Details
Closed on
Aug 18, 1997
Sold by
Cinege Paul
Bought by
Goldish Matthew and Naumyk Patricia
Create a Home Valuation Report for This Property
The Home Valuation Report is an in-depth analysis detailing your home's value as well as a comparison with similar homes in the area
Home Values in the Area
Average Home Value in this Area
Purchase History
| Date | Buyer | Sale Price | Title Company |
|---|---|---|---|
| Rajamanickam Sivasankaran C | $540,000 | -- | |
| Rajamanickam Sivasankaran C | $540,000 | None Listed On Document | |
| Goldish Matthew | $110,000 | -- |
Source: Public Records
Mortgage History
| Date | Status | Borrower | Loan Amount |
|---|---|---|---|
| Open | Rajamanickam Sivasankaran C | $647,200 | |
| Closed | Rajamanickam Sivasankaran C | $647,200 |
Source: Public Records
Tax History Compared to Growth
Tax History
| Year | Tax Paid | Tax Assessment Tax Assessment Total Assessment is a certain percentage of the fair market value that is determined by local assessors to be the total taxable value of land and additions on the property. | Land | Improvement |
|---|---|---|---|---|
| 2025 | $25,053 | $185,100 | $22,000 | $163,100 |
| 2024 | $23,905 | $185,100 | $22,000 | $163,100 |
| 2023 | $23,905 | $181,100 | $22,000 | $159,100 |
| 2022 | $9,656 | $77,900 | $22,000 | $55,900 |
| 2021 | $9,557 | $77,900 | $22,000 | $55,900 |
| 2020 | $9,242 | $77,900 | $22,000 | $55,900 |
| 2019 | $9,008 | $77,900 | $22,000 | $55,900 |
| 2018 | $8,771 | $77,900 | $22,000 | $55,900 |
| 2017 | $8,594 | $77,900 | $22,000 | $55,900 |
| 2016 | $8,512 | $77,900 | $22,000 | $55,900 |
| 2015 | $8,345 | $77,900 | $22,000 | $55,900 |
| 2014 | $8,146 | $77,900 | $22,000 | $55,900 |
Source: Public Records
Map
Nearby Homes