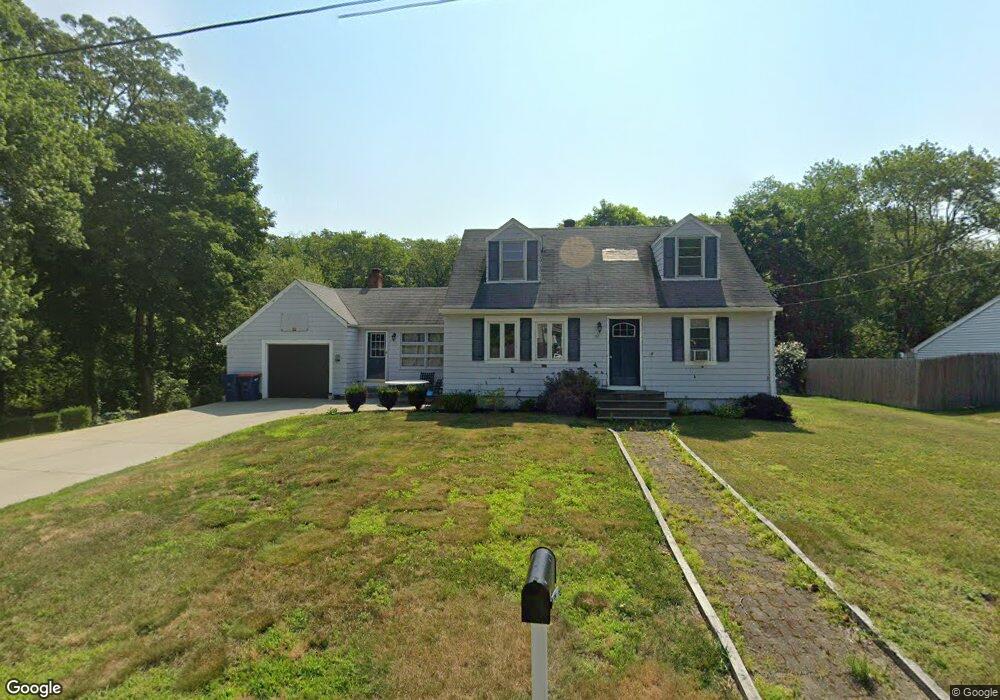
43 Benson Ave Seekonk, MA 02771
Monroes-South Seekonk NeighborhoodEstimated Value: $477,000 - $538,000
4
Beds
1
Bath
1,794
Sq Ft
$284/Sq Ft
Est. Value
About This Home
This home is located at 43 Benson Ave, Seekonk, MA 02771 and is currently estimated at $510,194, approximately $284 per square foot. 43 Benson Ave is a home located in Bristol County with nearby schools including Seekonk High School, St Mary Academy-Bay View, and Providence Country Day School.
Ownership History
Date
Name
Owned For
Owner Type
Purchase Details
Closed on
Feb 8, 2021
Sold by
Machado Paul S
Bought by
Machado Erin R
Current Estimated Value
Purchase Details
Closed on
May 8, 2007
Sold by
Machado Henry F and Farias Donna M
Bought by
Machado Paul S and Machado Erin R
Home Financials for this Owner
Home Financials are based on the most recent Mortgage that was taken out on this home.
Original Mortgage
$243,000
Interest Rate
6.23%
Mortgage Type
Purchase Money Mortgage
Create a Home Valuation Report for This Property
The Home Valuation Report is an in-depth analysis detailing your home's value as well as a comparison with similar homes in the area
Home Values in the Area
Average Home Value in this Area
Purchase History
| Date | Buyer | Sale Price | Title Company |
|---|---|---|---|
| Machado Erin R | -- | None Available | |
| Machado Paul S | $283,000 | -- |
Source: Public Records
Mortgage History
| Date | Status | Borrower | Loan Amount |
|---|---|---|---|
| Previous Owner | Machado Paul S | $243,000 |
Source: Public Records
Tax History
| Year | Tax Paid | Tax Assessment Tax Assessment Total Assessment is a certain percentage of the fair market value that is determined by local assessors to be the total taxable value of land and additions on the property. | Land | Improvement |
|---|---|---|---|---|
| 2025 | $4,858 | $393,400 | $178,600 | $214,800 |
| 2024 | $4,689 | $379,700 | $178,600 | $201,100 |
| 2023 | $4,364 | $332,900 | $159,800 | $173,100 |
| 2022 | $4,013 | $300,800 | $153,300 | $147,500 |
| 2021 | $3,808 | $280,600 | $136,300 | $144,300 |
| 2020 | $3,674 | $279,000 | $136,200 | $142,800 |
| 2019 | $3,471 | $265,800 | $128,000 | $137,800 |
| 2018 | $3,430 | $256,900 | $124,500 | $132,400 |
| 2017 | $3,356 | $249,300 | $121,400 | $127,900 |
| 2016 | $3,126 | $233,100 | $121,400 | $111,700 |
| 2015 | $3,048 | $230,400 | $121,400 | $109,000 |
Source: Public Records
Map
Nearby Homes
- 0 N Wheaton Ave
- 57 Mohawk Dr
- 454 Fall River Ave
- 7 Jill Ct
- 42 Tee Jay Dr
- 30 Fuller St
- 34 Palmer River Rd
- 195 Barney Ave
- 65 Estrell Dr
- 2 Leigh Ln
- 0 Wheaton Ave
- 203 Providence St Bldr Lot 5
- 205 Providence St Bldr Lot 3
- 420 Chestnut St
- 1705 Wampanoag Trail
- 127 Mason St
- 6 Hazelton Rd
- 134 Mason St
- 15 George w Finnerty Rd
- 106 Wannamoisett Rd
Your Personal Tour Guide
Ask me questions while you tour the home.