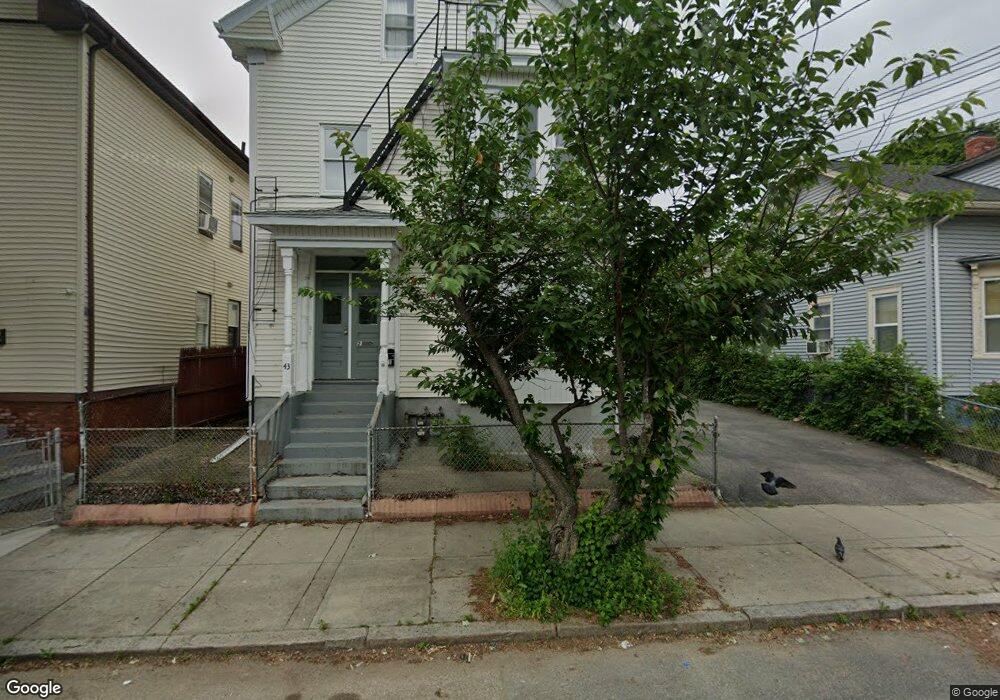
43 Bernon St Providence, RI 02908
Smith Hill NeighborhoodEstimated Value: $572,000 - $998,636
6
Beds
2
Baths
3,068
Sq Ft
$242/Sq Ft
Est. Value
About This Home
This home is located at 43 Bernon St, Providence, RI 02908 and is currently estimated at $742,909, approximately $242 per square foot. 43 Bernon St is a home located in Providence County with nearby schools including Times Squared Academy, Times2 Elementary School, and Times2 Middle/High School.
Ownership History
Date
Name
Owned For
Owner Type
Purchase Details
Closed on
Oct 7, 2011
Sold by
Fnma
Bought by
Bartolomeo Todd
Current Estimated Value
Purchase Details
Closed on
Aug 9, 2011
Sold by
Filpo Nicolas and Fnma
Bought by
Federal National Mortgage Association
Purchase Details
Closed on
Dec 10, 2008
Sold by
Filpo Nicolas and Fnma
Bought by
Federal National Mortgage Association
Purchase Details
Closed on
Nov 30, 1995
Sold by
Prov Plan Hsng Corp
Bought by
Chinea Jaimet and Filpo Nicolas
Purchase Details
Closed on
Oct 23, 1990
Sold by
Brodsky Vladimir
Bought by
Escobar Adelberto
Create a Home Valuation Report for This Property
The Home Valuation Report is an in-depth analysis detailing your home's value as well as a comparison with similar homes in the area
Home Values in the Area
Average Home Value in this Area
Purchase History
| Date | Buyer | Sale Price | Title Company |
|---|---|---|---|
| Bartolomeo Todd | $64,700 | -- | |
| Federal National Mortgage Association | $344,507 | -- | |
| Federal National Mortgage Association | $272,286 | -- | |
| Chinea Jaimet | $80,000 | -- | |
| Escobar Adelberto | $120,000 | -- | |
| Escobar Adelberto | $120,000 | -- |
Source: Public Records
Mortgage History
| Date | Status | Borrower | Loan Amount |
|---|---|---|---|
| Previous Owner | Escobar Adelberto | $260,000 | |
| Previous Owner | Escobar Adelberto | $175,000 | |
| Previous Owner | Escobar Adelberto | $129,000 |
Source: Public Records
Tax History
| Year | Tax Paid | Tax Assessment Tax Assessment Total Assessment is a certain percentage of the fair market value that is determined by local assessors to be the total taxable value of land and additions on the property. | Land | Improvement |
|---|---|---|---|---|
| 2025 | $6,968 | $497,700 | $142,200 | $355,500 |
| 2024 | $5,837 | $318,100 | $67,200 | $250,900 |
| 2023 | $5,837 | $318,100 | $67,200 | $250,900 |
| 2022 | $5,662 | $318,100 | $67,200 | $250,900 |
| 2021 | $4,809 | $195,800 | $33,100 | $162,700 |
| 2020 | $4,809 | $195,800 | $33,100 | $162,700 |
| 2019 | $4,809 | $195,800 | $33,100 | $162,700 |
| 2018 | $4,433 | $138,700 | $35,600 | $103,100 |
| 2017 | $4,433 | $138,700 | $35,600 | $103,100 |
| 2016 | $4,433 | $138,700 | $35,600 | $103,100 |
| 2015 | $4,349 | $131,400 | $46,500 | $84,900 |
| 2014 | $4,435 | $131,400 | $46,500 | $84,900 |
| 2013 | $4,435 | $131,400 | $46,500 | $84,900 |
Source: Public Records
Map
Nearby Homes
- 65 Douglas Ave
- 15 Crimea St
- 42 Derry St
- 471 Chalkstone Ave
- 21 Candace St
- 18 Winsor St
- 522 Chalkstone Ave
- 28 Pumgansett St
- 154 Camden Ave
- 1000 Providence Place Unit 120
- 1000 Providence Place Unit 451
- 1000 Providence Place Unit 339
- 1000 Providence Place Unit 101
- 1000 Providence Place Unit 221
- 1000 Providence Place Unit 301
- 23 Richter St
- 111 Donelson St
- 0 Donelson St
- 154 Oakland Ave
- 162 Oakland Ave
Your Personal Tour Guide
Ask me questions while you tour the home.