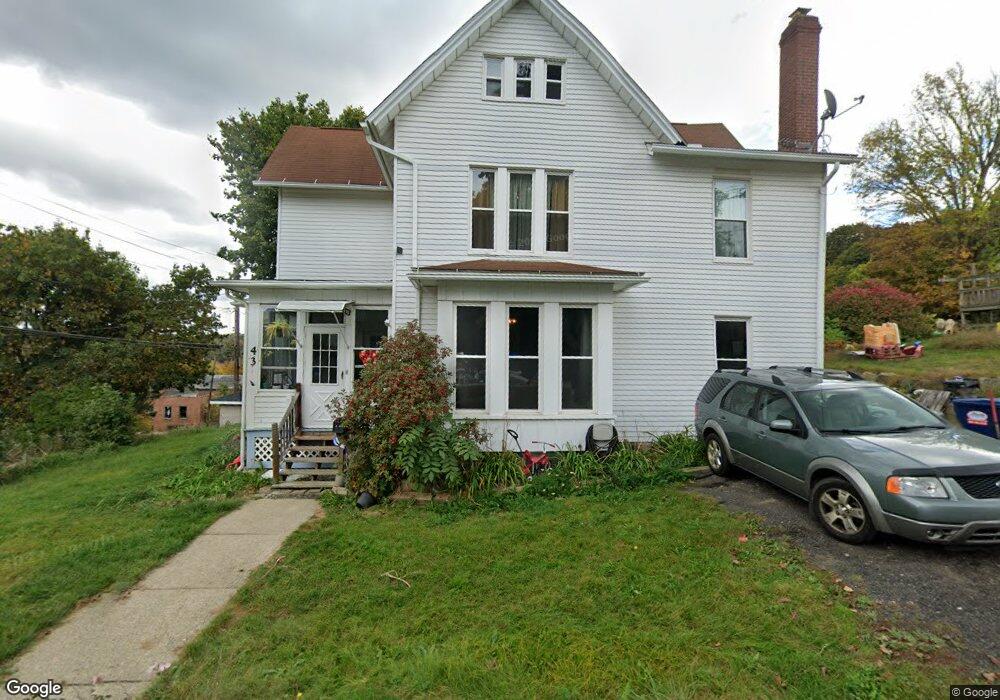
43 Bridge St Winsted, CT 06098
Estimated Value: $241,000 - $325,000
4
Beds
2
Baths
2,083
Sq Ft
$136/Sq Ft
Est. Value
About This Home
This home is located at 43 Bridge St, Winsted, CT 06098 and is currently estimated at $282,764, approximately $135 per square foot. 43 Bridge St is a home located in Litchfield County with nearby schools including Pearson School, Explorations Charter School, and St Anthony School.
Ownership History
Date
Name
Owned For
Owner Type
Purchase Details
Closed on
Sep 28, 2020
Sold by
Tremblay Johnathan and Somers-Tremblay Loretta
Bought by
Valeska-Tuz Caitlyn and Tuz Charles J
Current Estimated Value
Home Financials for this Owner
Home Financials are based on the most recent Mortgage that was taken out on this home.
Original Mortgage
$143,355
Outstanding Balance
$127,218
Interest Rate
2.9%
Mortgage Type
FHA
Estimated Equity
$155,546
Purchase Details
Closed on
Feb 3, 2015
Sold by
Tremblay Johnathan and Somers-Tremblay Loretta
Bought by
Tremblat Johnathan and Somers-Tremblay Loretta
Home Financials for this Owner
Home Financials are based on the most recent Mortgage that was taken out on this home.
Original Mortgage
$124,887
Interest Rate
4.87%
Mortgage Type
FHA
Purchase Details
Closed on
Nov 13, 2007
Sold by
Mangle William E and Mangle Catherine
Bought by
Tremblay Jonathan and Tremblay Loretta
Home Financials for this Owner
Home Financials are based on the most recent Mortgage that was taken out on this home.
Original Mortgage
$148,700
Interest Rate
6.47%
Create a Home Valuation Report for This Property
The Home Valuation Report is an in-depth analysis detailing your home's value as well as a comparison with similar homes in the area
Home Values in the Area
Average Home Value in this Area
Purchase History
| Date | Buyer | Sale Price | Title Company |
|---|---|---|---|
| Valeska-Tuz Caitlyn | $146,000 | None Available | |
| Valeska-Tuz Caitlyn | $146,000 | None Available | |
| Tremblat Johnathan | -- | -- | |
| Tremblat Johnathan | -- | -- | |
| Tremblay Jonathan | $149,900 | -- | |
| Tremblay Jonathan | $149,900 | -- |
Source: Public Records
Mortgage History
| Date | Status | Borrower | Loan Amount |
|---|---|---|---|
| Open | Valeska-Tuz Caitlyn | $143,355 | |
| Closed | Valeska-Tuz Caitlyn | $143,355 | |
| Previous Owner | Tremblat Johnathan | $124,887 | |
| Previous Owner | Tremblay Jonathan | $148,700 |
Source: Public Records
Tax History
| Year | Tax Paid | Tax Assessment Tax Assessment Total Assessment is a certain percentage of the fair market value that is determined by local assessors to be the total taxable value of land and additions on the property. | Land | Improvement |
|---|---|---|---|---|
| 2025 | $3,530 | $121,030 | $24,430 | $96,600 |
| 2024 | $3,297 | $121,030 | $24,430 | $96,600 |
| 2023 | $3,194 | $121,030 | $24,430 | $96,600 |
| 2022 | $3,242 | $96,670 | $17,710 | $78,960 |
| 2021 | $3,242 | $96,670 | $17,710 | $78,960 |
| 2020 | $3,242 | $96,670 | $17,710 | $78,960 |
| 2019 | $3,242 | $96,670 | $17,710 | $78,960 |
| 2018 | $3,242 | $96,670 | $17,710 | $78,960 |
| 2017 | $3,275 | $97,650 | $17,710 | $79,940 |
| 2016 | $3,275 | $97,650 | $17,710 | $79,940 |
| 2015 | $3,193 | $97,650 | $17,710 | $79,940 |
| 2014 | $3,076 | $96,390 | $17,710 | $78,680 |
Source: Public Records
Map
Nearby Homes
Your Personal Tour Guide
Ask me questions while you tour the home.