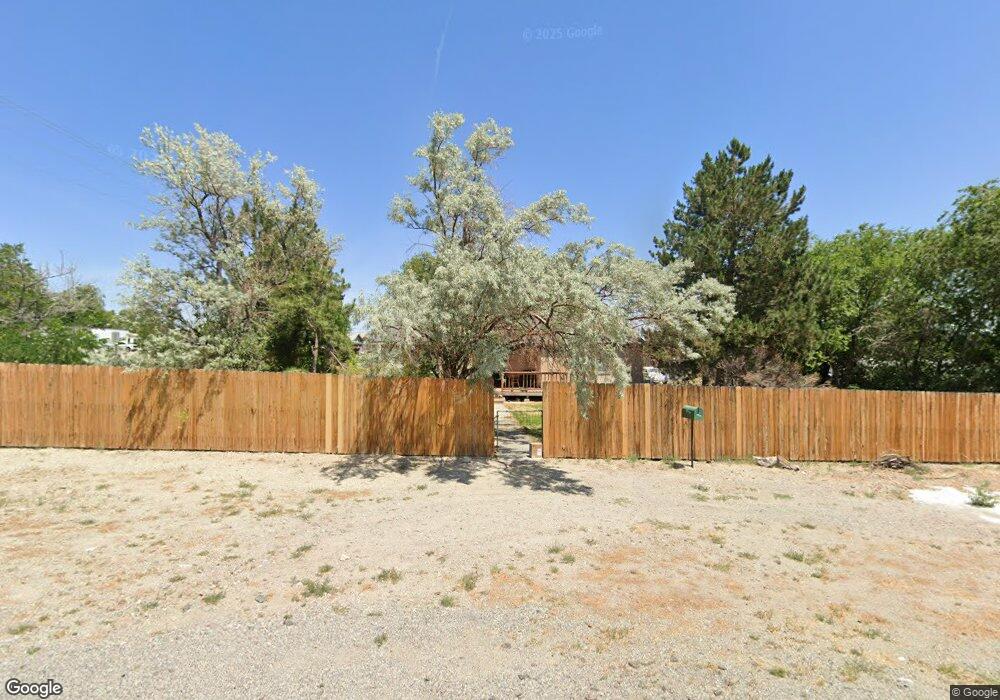
43 Bridge St Yerington, NV 89447
Estimated Value: $189,000 - $223,000
3
Beds
2
Baths
1,128
Sq Ft
$179/Sq Ft
Est. Value
About This Home
This home is located at 43 Bridge St, Yerington, NV 89447 and is currently estimated at $201,767, approximately $178 per square foot. 43 Bridge St is a home located in Lyon County with nearby schools including Yerington Elementary School, Yerington Intermediate School, and Yerington High School.
Ownership History
Date
Name
Owned For
Owner Type
Purchase Details
Closed on
Dec 17, 2004
Sold by
Larrabee Larry J
Bought by
Trunk Michael A and Juntunen Shannon R
Current Estimated Value
Home Financials for this Owner
Home Financials are based on the most recent Mortgage that was taken out on this home.
Original Mortgage
$87,300
Outstanding Balance
$43,545
Interest Rate
5.67%
Mortgage Type
New Conventional
Estimated Equity
$158,222
Purchase Details
Closed on
Dec 1, 2004
Sold by
Larrabee Janice E
Bought by
Larrabee Larry L
Home Financials for this Owner
Home Financials are based on the most recent Mortgage that was taken out on this home.
Original Mortgage
$87,300
Outstanding Balance
$43,545
Interest Rate
5.67%
Mortgage Type
New Conventional
Estimated Equity
$158,222
Create a Home Valuation Report for This Property
The Home Valuation Report is an in-depth analysis detailing your home's value as well as a comparison with similar homes in the area
Home Values in the Area
Average Home Value in this Area
Purchase History
| Date | Buyer | Sale Price | Title Company |
|---|---|---|---|
| Trunk Michael A | $90,000 | Western Title Company Inc | |
| Larrabee Larry L | $90,000 | Western Title Company |
Source: Public Records
Mortgage History
| Date | Status | Borrower | Loan Amount |
|---|---|---|---|
| Open | Trunk Michael A | $87,300 |
Source: Public Records
Tax History Compared to Growth
Tax History
| Year | Tax Paid | Tax Assessment Tax Assessment Total Assessment is a certain percentage of the fair market value that is determined by local assessors to be the total taxable value of land and additions on the property. | Land | Improvement |
|---|---|---|---|---|
| 2025 | $531 | $38,860 | $21,175 | $17,686 |
| 2024 | $516 | $38,630 | $21,175 | $17,455 |
| 2023 | $516 | $37,073 | $21,175 | $15,898 |
| 2022 | $483 | $30,566 | $16,275 | $14,291 |
| 2021 | $465 | $24,405 | $10,700 | $13,705 |
| 2020 | $451 | $23,642 | $10,700 | $12,942 |
| 2019 | $438 | $22,967 | $10,700 | $12,267 |
| 2018 | $420 | $15,476 | $3,750 | $11,726 |
| 2017 | $408 | $15,275 | $3,750 | $11,525 |
| 2016 | $398 | $12,765 | $3,750 | $9,015 |
| 2015 | $408 | $10,644 | $3,750 | $6,894 |
| 2014 | $385 | $13,225 | $3,750 | $9,475 |
Source: Public Records
Map
Nearby Homes