
43 Brookside Dr Killingly, CT 06241
3
Beds
2.5
Baths
1,600
Sq Ft
0.78
Acres
Highlights
- Colonial Architecture
- Attic
- Balcony
- Deck
- No HOA
- Thermal Windows
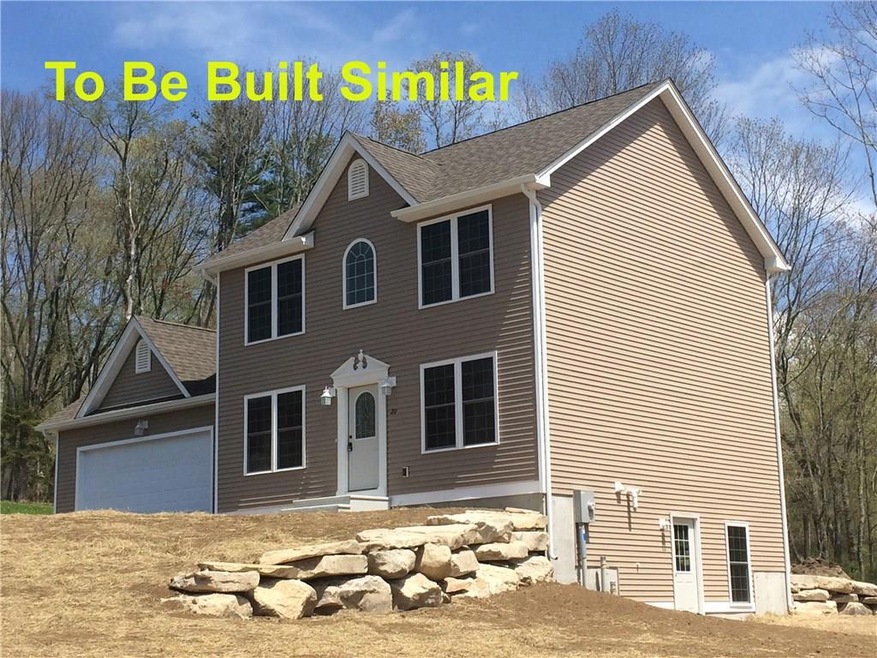
About This Home
As of February 2025This Custom popular model features Huge Kitchen Island with affordable, adjustable, high end cabinetry, open floor plan and vaulted master suite. Feel the luxury of Hardwoods and Tile while you watch the sun rise through your kitchen slider. Elevated view overlooks an abundance of wild life. Plenty of room for expansion. Conveniently located near Killingly Commons and an easy commute to Worcester, Hartford, Providence and Groton. Brookside offers underground utilities, public sewer, conservation areas and lot sizes of .69 to 2.98 acres. Our propane pricing and 93% efficient heating system will save you every month and our patient builder will customize the plan to fit your lifestyle. Come visit Brookside Estates Today!
Last Agent to Sell the Property
Larrow's Real Estate License #REB.0387129 Listed on: 07/07/2016
Home Details
Home Type
- Single Family
Est. Annual Taxes
- $869
Year Built
- Built in 2017
Lot Details
- 0.78 Acre Lot
- Cul-De-Sac
Home Design
- Colonial Architecture
- Vinyl Siding
Interior Spaces
- 1,600 Sq Ft Home
- Thermal Windows
- Basement Fills Entire Space Under The House
- Attic or Crawl Hatchway Insulated
Bedrooms and Bathrooms
- 3 Bedrooms
Parking
- 2 Car Attached Garage
- Parking Deck
- Gravel Driveway
Outdoor Features
- Balcony
- Deck
- Exterior Lighting
- Rain Gutters
Schools
- Killingly Central Elementary School
- Killingly Middle School
- Killingly High School
Utilities
- Zoned Heating
- Baseboard Heating
- Heating System Uses Propane
- Underground Utilities
- Private Company Owned Well
- Propane Water Heater
- Fuel Tank Located in Ground
- Cable TV Available
Community Details
- No Home Owners Association
- Brookside Estates Subdivision
Ownership History
Date
Name
Owned For
Owner Type
Purchase Details
Listed on
Nov 21, 2024
Closed on
Feb 13, 2025
Sold by
Gagne Ryan J and Gagne Sarah K
Bought by
Gum Jennifer and Melenduy Trevor T
Seller's Agent
Gregory Coupe
Long Realty,Inc.
Buyer's Agent
Barbara Hopkins
Media Realty Group, Inc.
List Price
$499,900
Sold Price
$462,500
Premium/Discount to List
-$37,400
-7.48%
Views
66
Current Estimated Value
Home Financials for this Owner
Home Financials are based on the most recent Mortgage that was taken out on this home.
Estimated Appreciation
$1,500
Avg. Annual Appreciation
1.53%
Original Mortgage
$437,500
Outstanding Balance
$435,454
Interest Rate
6.38%
Mortgage Type
Purchase Money Mortgage
Estimated Equity
$30,358
Purchase Details
Listed on
May 25, 2018
Closed on
Jul 16, 2018
Sold by
Martufi Michael
Bought by
Gagne Ryan J and Gagne Sarah K
Seller's Agent
valerie knight
Compass Rose Realty RI
Buyer's Agent
Gregory Coupe
Long Realty, Inc.
List Price
$285,000
Sold Price
$286,000
Premium/Discount to List
$1,000
0.35%
Home Financials for this Owner
Home Financials are based on the most recent Mortgage that was taken out on this home.
Avg. Annual Appreciation
7.57%
Original Mortgage
$246,000
Interest Rate
4.5%
Mortgage Type
New Conventional
Purchase Details
Listed on
Jul 7, 2016
Closed on
Feb 1, 2017
Sold by
Brookside Estates Llc
Bought by
Martufi Michael
Seller's Agent
Gene Larrow
Larrow's Real Estate
Buyer's Agent
Gene Larrow
Larrow's Real Estate
List Price
$256,500
Sold Price
$255,000
Premium/Discount to List
-$1,500
-0.58%
Home Financials for this Owner
Home Financials are based on the most recent Mortgage that was taken out on this home.
Avg. Annual Appreciation
8.18%
Similar Homes in the area
Create a Home Valuation Report for This Property
The Home Valuation Report is an in-depth analysis detailing your home's value as well as a comparison with similar homes in the area
Home Values in the Area
Average Home Value in this Area
Purchase History
| Date | Type | Sale Price | Title Company |
|---|---|---|---|
| Warranty Deed | $462,500 | None Available | |
| Warranty Deed | $462,500 | None Available | |
| Warranty Deed | -- | -- | |
| Warranty Deed | -- | -- | |
| Warranty Deed | $255,000 | -- | |
| Warranty Deed | $255,000 | -- |
Source: Public Records
Mortgage History
| Date | Status | Loan Amount | Loan Type |
|---|---|---|---|
| Open | $437,500 | Purchase Money Mortgage | |
| Closed | $437,500 | Purchase Money Mortgage | |
| Previous Owner | $240,000 | Stand Alone Refi Refinance Of Original Loan | |
| Previous Owner | $8,000 | Stand Alone Refi Refinance Of Original Loan | |
| Previous Owner | $241,300 | Stand Alone Refi Refinance Of Original Loan | |
| Previous Owner | $246,000 | New Conventional |
Source: Public Records
Property History
| Date | Event | Price | Change | Sq Ft Price |
|---|---|---|---|---|
| 02/14/2025 02/14/25 | Sold | $462,500 | -2.6% | $190 / Sq Ft |
| 12/24/2024 12/24/24 | Pending | -- | -- | -- |
| 12/08/2024 12/08/24 | Price Changed | $474,900 | -5.0% | $195 / Sq Ft |
| 11/21/2024 11/21/24 | For Sale | $499,900 | +74.8% | $205 / Sq Ft |
| 07/17/2018 07/17/18 | Sold | $286,000 | +0.4% | $173 / Sq Ft |
| 06/17/2018 06/17/18 | Pending | -- | -- | -- |
| 05/25/2018 05/25/18 | For Sale | $285,000 | +11.8% | $173 / Sq Ft |
| 01/31/2017 01/31/17 | Sold | $255,000 | -0.6% | $159 / Sq Ft |
| 07/21/2016 07/21/16 | Pending | -- | -- | -- |
| 07/07/2016 07/07/16 | For Sale | $256,500 | -- | $160 / Sq Ft |
Source: SmartMLS
Tax History Compared to Growth
Tax History
| Year | Tax Paid | Tax Assessment Tax Assessment Total Assessment is a certain percentage of the fair market value that is determined by local assessors to be the total taxable value of land and additions on the property. | Land | Improvement |
|---|---|---|---|---|
| 2025 | $6,487 | $276,650 | $33,260 | $243,390 |
| 2024 | $6,106 | $276,650 | $33,260 | $243,390 |
| 2023 | $5,733 | $200,120 | $26,960 | $173,160 |
| 2022 | $5,398 | $200,590 | $27,430 | $173,160 |
| 2021 | $5,308 | $197,260 | $27,440 | $169,820 |
| 2020 | $5,196 | $197,260 | $27,440 | $169,820 |
| 2019 | $5,298 | $197,260 | $27,440 | $169,820 |
| 2017 | $4,676 | $160,090 | $27,440 | $132,650 |
| 2016 | $799 | $27,440 | $27,440 | $0 |
| 2015 | $804 | $27,440 | $27,440 | $0 |
| 2014 | $782 | $27,440 | $27,440 | $0 |
Source: Public Records
Agents Affiliated with this Home
-
Seller's Agent in 2025
Gregory Coupe
Long Realty,Inc.
(401) 647-5454
7 in this area
215 Total Sales
-
Buyer's Agent in 2025
Barbara Hopkins
Media Realty Group, Inc.
(508) 868-4236
1 in this area
21 Total Sales
-
v
Seller's Agent in 2018
valerie knight
Compass Rose Realty RI
-
Seller's Agent in 2017
Gene Larrow
Larrow's Real Estate
(860) 428-0500
19 in this area
44 Total Sales
Map
Source: SmartMLS
MLS Number: E10150543
APN: KILL-000128-000000-000027
Disclaimer: Certain information contained herein is derived from information provided by parties other than Homes.com. All information provided is deemed reliable, but is not guaranteed to be accurate and should be independently verified.
![]() IDX information is provided exclusively for personal, non-commercial use, and may not be used for any purpose other than to identify prospective properties consumers may be interested in purchasing. Information is deemed reliable but not guaranteed.
IDX information is provided exclusively for personal, non-commercial use, and may not be used for any purpose other than to identify prospective properties consumers may be interested in purchasing. Information is deemed reliable but not guaranteed.
Nearby Homes
- 36 Breakneck Hill Rd
- 842 Hartford Pike
- 1063 N Main St
- 18 Valley View Dr
- 114 Breakneck Hill Rd
- 778 Cook Hill Rd
- 61 Deerwood Dr
- 32 Mockingbird Dr
- 4 Skylark Ln Unit 4
- 183 Putnam Pike
- 503 Indian Springs Pkwy
- 502 Indian Springs Pkwy
- 300 Valley Rd
- 395 Hartford Pike
- 686 Cook Hill Rd
- 24 Ferland Dr
- 12 John St
- 90 Putnam Pike
- 350 Breakneck Hill Rd
- 18 Isabellas Place