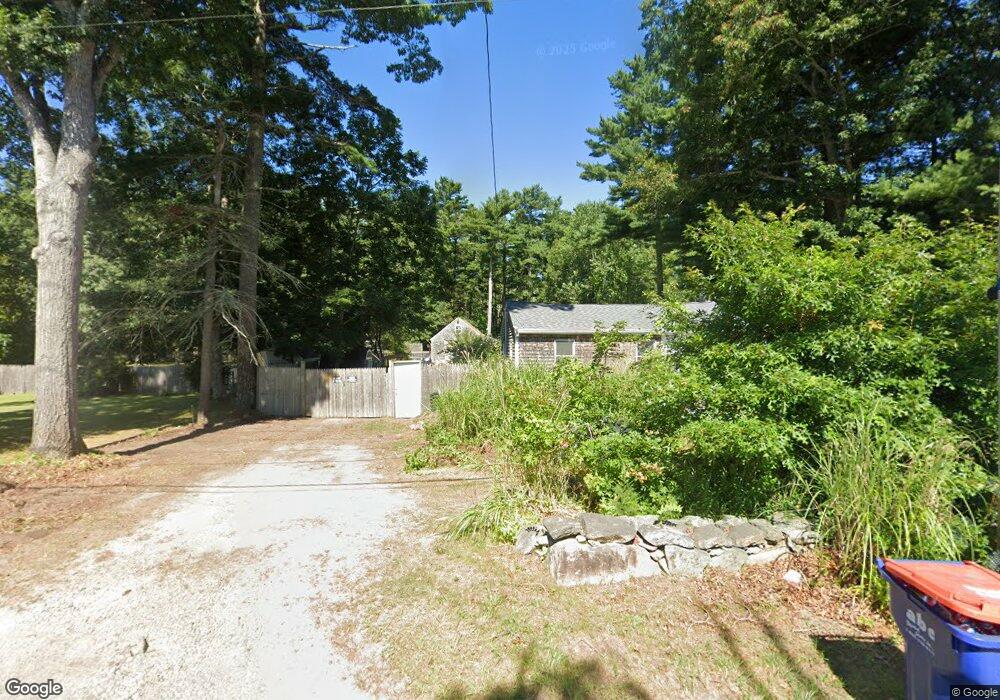
43 Carver Rd West Wareham, MA 02576
Estimated Value: $368,000 - $434,000
2
Beds
1
Bath
1,100
Sq Ft
$365/Sq Ft
Est. Value
About This Home
This home is located at 43 Carver Rd, West Wareham, MA 02576 and is currently estimated at $401,019, approximately $364 per square foot. 43 Carver Rd is a home located in Plymouth County.
Ownership History
Date
Name
Owned For
Owner Type
Purchase Details
Closed on
Oct 17, 2006
Sold by
Doherty Daniel G and Doherty Oneida L
Bought by
Meehan Brenda
Current Estimated Value
Home Financials for this Owner
Home Financials are based on the most recent Mortgage that was taken out on this home.
Original Mortgage
$191,200
Outstanding Balance
$114,156
Interest Rate
6.47%
Mortgage Type
Purchase Money Mortgage
Estimated Equity
$286,863
Purchase Details
Closed on
Mar 30, 2006
Sold by
Doherty John M
Bought by
Doherty Daniel G and Doherty Oneida L
Purchase Details
Closed on
Nov 9, 2004
Sold by
Doherty Daniel G and Doherty Oneida L
Bought by
Doherty John M and Doherty Daniel G
Purchase Details
Closed on
Mar 14, 2003
Sold by
Liffers Robert C and Liffers Becky
Bought by
Doherty Daniel G and Doherty Oneida L
Create a Home Valuation Report for This Property
The Home Valuation Report is an in-depth analysis detailing your home's value as well as a comparison with similar homes in the area
Home Values in the Area
Average Home Value in this Area
Purchase History
| Date | Buyer | Sale Price | Title Company |
|---|---|---|---|
| Meehan Brenda | $239,000 | -- | |
| Meehan Brenda | $239,000 | -- | |
| Doherty Daniel G | -- | -- | |
| Doherty Daniel G | -- | -- | |
| Doherty John M | -- | -- | |
| Doherty John M | -- | -- | |
| Doherty Daniel G | $160,000 | -- | |
| Doherty Daniel G | $160,000 | -- |
Source: Public Records
Mortgage History
| Date | Status | Borrower | Loan Amount |
|---|---|---|---|
| Open | Doherty Daniel G | $191,200 | |
| Closed | Doherty Daniel G | $47,800 |
Source: Public Records
Tax History Compared to Growth
Tax History
| Year | Tax Paid | Tax Assessment Tax Assessment Total Assessment is a certain percentage of the fair market value that is determined by local assessors to be the total taxable value of land and additions on the property. | Land | Improvement |
|---|---|---|---|---|
| 2025 | $3,576 | $343,200 | $126,100 | $217,100 |
| 2024 | $3,254 | $289,800 | $100,100 | $189,700 |
| 2023 | $3,176 | $264,000 | $90,900 | $173,100 |
| 2022 | $3,114 | $236,300 | $90,900 | $145,400 |
| 2021 | $3,114 | $231,500 | $90,900 | $140,600 |
| 2020 | $5,053 | $223,300 | $90,900 | $132,400 |
| 2019 | $2,767 | $208,200 | $91,900 | $116,300 |
| 2018 | $2,663 | $195,400 | $91,900 | $103,500 |
| 2017 | $2,506 | $186,300 | $91,900 | $94,400 |
| 2016 | $2,373 | $175,400 | $91,900 | $83,500 |
| 2015 | $2,292 | $175,400 | $91,900 | $83,500 |
| 2014 | $2,294 | $178,500 | $91,900 | $86,600 |
Source: Public Records
Map
Nearby Homes
- 47 Weaver St
- 2230 Cranberry Hwy Unit 1
- 563 County Rd
- 20 Gault Rd
- 72 Papermill Rd Unit 72
- 51 Crest Dr
- 103 Castle Dr
- 27 Siesta Dr
- 4 Siesta Dr
- 11 Acoaxet Ln
- 41 Longboat Rd
- 11 Fonseca Way
- 527 High St
- 59 Timber Ln
- 87 Great Hill Dr
- 490 High St
- 7 Forbes Rd
- 189 Pine View Terrace
- 46 Helen St
- 199 Windswept Rd