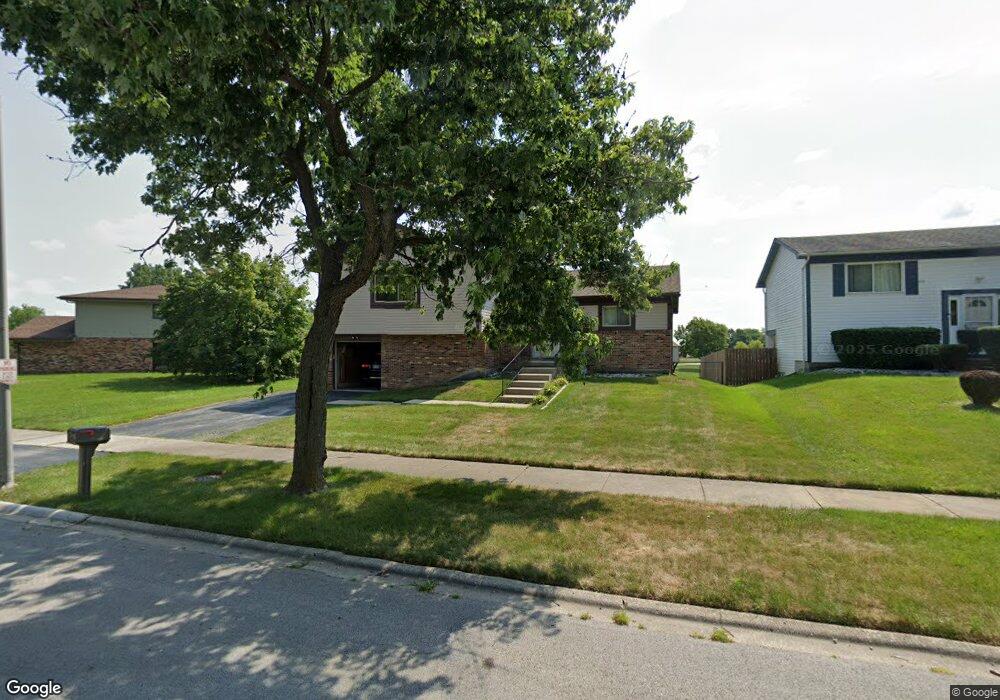
43 Cloverleaf Rd Matteson, IL 60443
West Matteson NeighborhoodEstimated Value: $207,000 - $265,000
3
Beds
2
Baths
1,260
Sq Ft
$188/Sq Ft
Est. Value
About This Home
This home is located at 43 Cloverleaf Rd, Matteson, IL 60443 and is currently estimated at $236,896, approximately $188 per square foot. 43 Cloverleaf Rd is a home located in Cook County with nearby schools including Colin Powell Middle School.
Ownership History
Date
Name
Owned For
Owner Type
Purchase Details
Closed on
Aug 13, 1999
Sold by
Badie William W and Cunningham Cheri D
Bought by
Williams Kenneth and Williams Rose
Current Estimated Value
Home Financials for this Owner
Home Financials are based on the most recent Mortgage that was taken out on this home.
Original Mortgage
$109,000
Outstanding Balance
$31,617
Interest Rate
7.77%
Mortgage Type
VA
Estimated Equity
$205,279
Create a Home Valuation Report for This Property
The Home Valuation Report is an in-depth analysis detailing your home's value as well as a comparison with similar homes in the area
Home Values in the Area
Average Home Value in this Area
Purchase History
| Date | Buyer | Sale Price | Title Company |
|---|---|---|---|
| Williams Kenneth | $107,000 | -- |
Source: Public Records
Mortgage History
| Date | Status | Borrower | Loan Amount |
|---|---|---|---|
| Open | Williams Kenneth | $109,000 |
Source: Public Records
Tax History Compared to Growth
Tax History
| Year | Tax Paid | Tax Assessment Tax Assessment Total Assessment is a certain percentage of the fair market value that is determined by local assessors to be the total taxable value of land and additions on the property. | Land | Improvement |
|---|---|---|---|---|
| 2024 | $6,502 | $19,000 | $3,360 | $15,640 |
| 2023 | $4,327 | $19,000 | $3,360 | $15,640 |
| 2022 | $4,327 | $11,755 | $2,940 | $8,815 |
| 2021 | $4,416 | $11,502 | $2,940 | $8,562 |
| 2020 | $6,007 | $11,502 | $2,940 | $8,562 |
| 2019 | $7,025 | $12,857 | $2,730 | $10,127 |
| 2018 | $6,923 | $12,857 | $2,730 | $10,127 |
| 2017 | $6,731 | $12,857 | $2,730 | $10,127 |
| 2016 | $6,208 | $11,996 | $2,520 | $9,476 |
| 2015 | $6,096 | $11,996 | $2,520 | $9,476 |
| 2014 | $5,930 | $11,996 | $2,520 | $9,476 |
| 2013 | $5,946 | $12,925 | $2,520 | $10,405 |
Source: Public Records
Map
Nearby Homes
- 116 Cloverleaf Rd
- 111 Deerpath Rd
- 5628 Crestwood Rd
- 5629 Crestwood Rd
- 50 Oakhurst Rd
- 5838 Woodgate Dr
- 5911 Timberlane Rd
- 5808 Allemong Dr
- 25 Pheasant Rd
- 13 Oakview Rd
- 123 Oriole Rd
- 42 Pheasant Rd
- 217 Oriole Rd
- 255 Central Ave
- 50 Willow Rd
- 322 Central Ave
- 10 Wedgewood Rd
- 340 Maryview Ct
- 6021 Spring Ln
- 192 Owen St
- 45 Cloverleaf Rd
- 5703 Woodgate Dr
- 47 Cloverleaf Rd
- 49 Cloverleaf Rd
- 48 Cloverleaf Rd
- 5700 Woodgate Dr
- 5660 Woodgate Dr
- 5715 Woodgate Dr
- 50 Cloverleaf Rd
- 5654 Woodgate Dr
- 51 Cloverleaf Rd
- 5740 Timberlane Rd
- 5708 Woodgate Dr Unit 6
- 41 Deerpath Rd
- 49 Deerpath Rd
- 54 Cloverleaf Rd
- 5646 Woodgate Dr
- 51 Deerpath Rd
- 55 Cloverleaf Rd