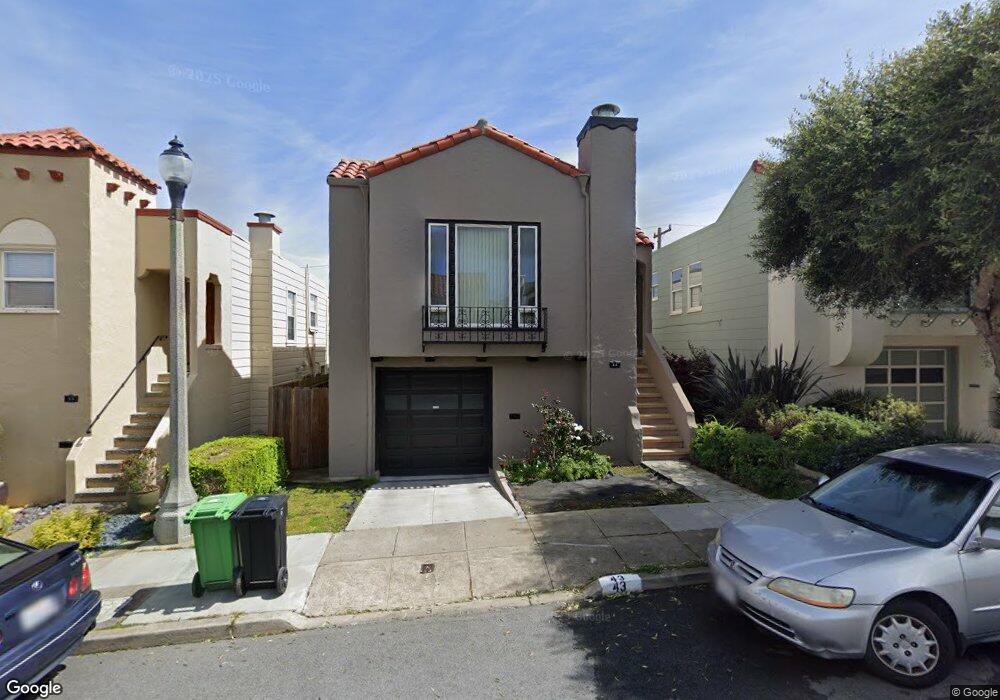
43 Colby St San Francisco, CA 94134
Portola NeighborhoodEstimated Value: $908,000 - $1,425,000
2
Beds
2
Baths
1,670
Sq Ft
$702/Sq Ft
Est. Value
About This Home
This home is located at 43 Colby St, San Francisco, CA 94134 and is currently estimated at $1,172,608, approximately $702 per square foot. 43 Colby St is a home located in San Francisco County with nearby schools including Hillcrest Elementary School, King Jr. (Martin Luther) Academic Middle School, and Cornerstone Academy.
Ownership History
Date
Name
Owned For
Owner Type
Purchase Details
Closed on
Dec 22, 2009
Sold by
Wong Cindy and Dong Wayne
Bought by
Wong Cindy and Dong Wayne
Current Estimated Value
Purchase Details
Closed on
Jun 12, 2009
Sold by
Wong Cindy
Bought by
Wong Cindy and Dong Wayne
Home Financials for this Owner
Home Financials are based on the most recent Mortgage that was taken out on this home.
Original Mortgage
$254,000
Outstanding Balance
$160,913
Interest Rate
4.82%
Mortgage Type
Purchase Money Mortgage
Estimated Equity
$1,011,695
Purchase Details
Closed on
Jan 30, 2003
Sold by
Wong Bryan G and Wong Patricia A
Bought by
Wong Cindy and Wong Bryan
Home Financials for this Owner
Home Financials are based on the most recent Mortgage that was taken out on this home.
Original Mortgage
$270,000
Interest Rate
5.83%
Purchase Details
Closed on
Sep 10, 2001
Sold by
Dong Wayne
Bought by
Wong Cindy
Home Financials for this Owner
Home Financials are based on the most recent Mortgage that was taken out on this home.
Original Mortgage
$100,000
Interest Rate
6.91%
Mortgage Type
Credit Line Revolving
Create a Home Valuation Report for This Property
The Home Valuation Report is an in-depth analysis detailing your home's value as well as a comparison with similar homes in the area
Home Values in the Area
Average Home Value in this Area
Purchase History
| Date | Buyer | Sale Price | Title Company |
|---|---|---|---|
| Wong Cindy | $170,000 | None Available | |
| Wong Cindy | -- | Yosemite Title Company | |
| Wong Cindy | $85,000 | Yosemite Title Company | |
| Wong Cindy | $85,000 | Yosemite Title Company | |
| Wong Cindy | -- | Alliance Title | |
| Wong Cindy | -- | North American Title Co |
Source: Public Records
Mortgage History
| Date | Status | Borrower | Loan Amount |
|---|---|---|---|
| Open | Wong Cindy | $254,000 | |
| Previous Owner | Wong Cindy | $270,000 | |
| Previous Owner | Wong Cindy | $100,000 |
Source: Public Records
Tax History Compared to Growth
Tax History
| Year | Tax Paid | Tax Assessment Tax Assessment Total Assessment is a certain percentage of the fair market value that is determined by local assessors to be the total taxable value of land and additions on the property. | Land | Improvement |
|---|---|---|---|---|
| 2025 | $6,230 | $480,866 | $268,737 | $212,129 |
| 2024 | $6,230 | $471,440 | $263,469 | $207,971 |
| 2023 | $6,127 | $462,197 | $258,303 | $203,894 |
| 2022 | $5,996 | $453,137 | $253,239 | $199,898 |
| 2021 | $5,884 | $444,254 | $248,274 | $195,980 |
| 2020 | $5,926 | $439,703 | $245,730 | $193,973 |
| 2019 | $5,725 | $431,084 | $240,912 | $190,172 |
| 2018 | $5,532 | $422,595 | $236,169 | $186,426 |
| 2017 | $5,167 | $414,312 | $231,540 | $182,772 |
| 2016 | $5,059 | $406,191 | $227,001 | $179,190 |
| 2015 | $4,994 | $400,092 | $223,593 | $176,499 |
| 2014 | $4,862 | $392,259 | $219,216 | $173,043 |
Source: Public Records
Map
Nearby Homes
- 38 Colby St
- 46 Dartmouth St
- 1029 Silver Ave
- 50 University St
- 920 Felton St
- 120 Princeton St
- 881 Moultrie St
- 886 Moultrie St
- 4243 Folsom St
- 132 Bache St
- 334 Alemany Blvd Unit 3
- 71 Gladstone Dr
- 141 Porter St
- 548 Burrows St
- 4190 Folsom St
- 4136 Folsom St
- 151 Sweeny St
- 607 Anderson St
- 1383 Bacon St
- 456 Nevada St