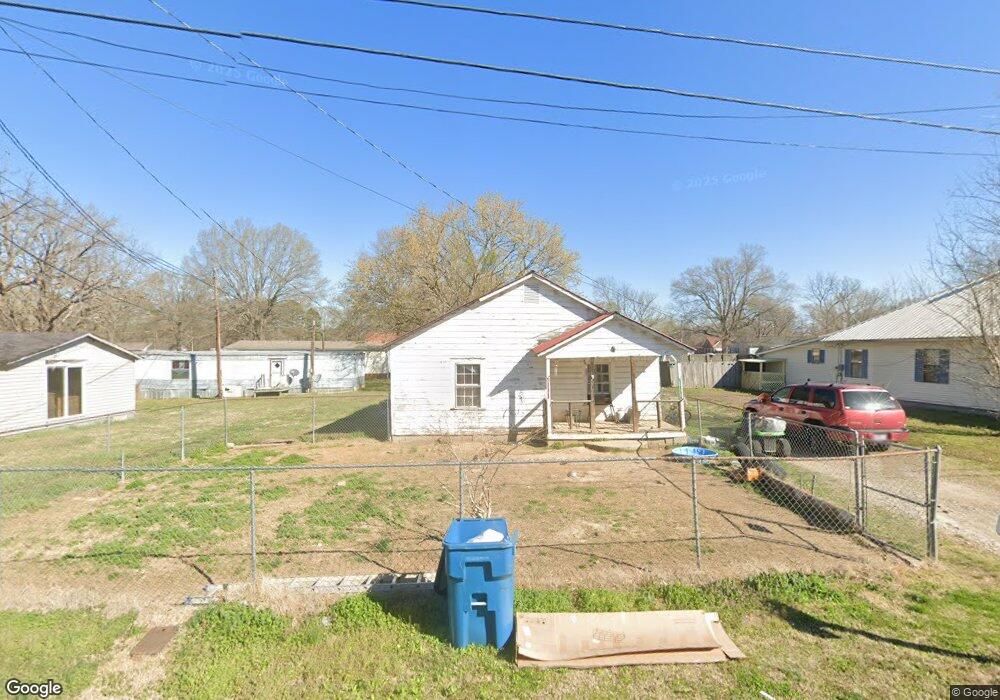
43 College St Bruceton, TN 38317
Estimated Value: $80,752 - $105,000
--
Bed
1
Bath
848
Sq Ft
$105/Sq Ft
Est. Value
About This Home
This home is located at 43 College St, Bruceton, TN 38317 and is currently estimated at $89,438, approximately $105 per square foot. 43 College St is a home located in Carroll County with nearby schools including Central Elementary School and Central High School.
Ownership History
Date
Name
Owned For
Owner Type
Purchase Details
Closed on
Feb 15, 2008
Sold by
Rose Land And Finance
Bought by
Speer James
Current Estimated Value
Purchase Details
Closed on
Jul 19, 2007
Sold by
Sub-Tr Jones J Phillip
Bought by
Rose Acceptance Inc
Purchase Details
Closed on
May 24, 1989
Bought by
Day Terry U and Day Tina
Purchase Details
Closed on
Mar 15, 1988
Bought by
Roberts Billy J and Roberts Sarah
Purchase Details
Closed on
Aug 7, 1978
Bought by
Hampton Carl L and Patty Fay
Purchase Details
Closed on
Jan 1, 1978
Create a Home Valuation Report for This Property
The Home Valuation Report is an in-depth analysis detailing your home's value as well as a comparison with similar homes in the area
Home Values in the Area
Average Home Value in this Area
Purchase History
| Date | Buyer | Sale Price | Title Company |
|---|---|---|---|
| Speer James | $10,000 | -- | |
| Rose Acceptance Inc | $21,738 | -- | |
| Day Terry U | $11,000 | -- | |
| Roberts Billy J | $10,000 | -- | |
| Hampton Carl L | -- | -- | |
| -- | $8,000 | -- |
Source: Public Records
Tax History Compared to Growth
Tax History
| Year | Tax Paid | Tax Assessment Tax Assessment Total Assessment is a certain percentage of the fair market value that is determined by local assessors to be the total taxable value of land and additions on the property. | Land | Improvement |
|---|---|---|---|---|
| 2024 | $332 | $6,725 | $500 | $6,225 |
| 2023 | $332 | $6,725 | $500 | $6,225 |
| 2022 | $332 | $6,725 | $500 | $6,225 |
| 2021 | $243 | $6,725 | $500 | $6,225 |
| 2020 | $332 | $6,725 | $500 | $6,225 |
| 2019 | $271 | $5,175 | $500 | $4,675 |
| 2018 | $271 | $5,175 | $500 | $4,675 |
| 2017 | $271 | $5,175 | $500 | $4,675 |
| 2016 | $348 | $5,175 | $500 | $4,675 |
| 2015 | $255 | $5,175 | $500 | $4,675 |
| 2014 | $265 | $5,175 | $500 | $4,675 |
| 2013 | $265 | $5,332 | $0 | $0 |
Source: Public Records
Map
Nearby Homes
- 29832 Broad St
- 104 Rowland Ave
- 0 Highway 70 E
- 26295 Highway 70 E
- 495 Rowland Mill Rd
- 114 Elm St
- 148 Highland St
- 126 Carroll St S
- 138 Carroll St S
- 180 Hillcrest Dr
- 450 High St
- 0 Holcomb St
- 204 Lankford St
- 210 Lankford St
- 420 General Forrest Dr
- 571 Cheatham St
- 106 Hemlock St
- 106 Wyatt St N
- 107 Hemlock St
- 23845 Tennessee 114
- 57 College St
- 107 Butler Speedway
- 69 College St
- 52 College St
- 83 College St
- 26 College St
- 30008 Broad St
- 29968 Broad St
- 29938 Broad St
- 408 College St
- 107 College St
- 30018 Broad St
- 10 College St
- 113 Butler Speedway
- 108 Butler Speedway
- 104 Butler Speedway
- 110 Butler Speedway
- 102 Butler Speedway
- 30026 Broad St
- 110 College St