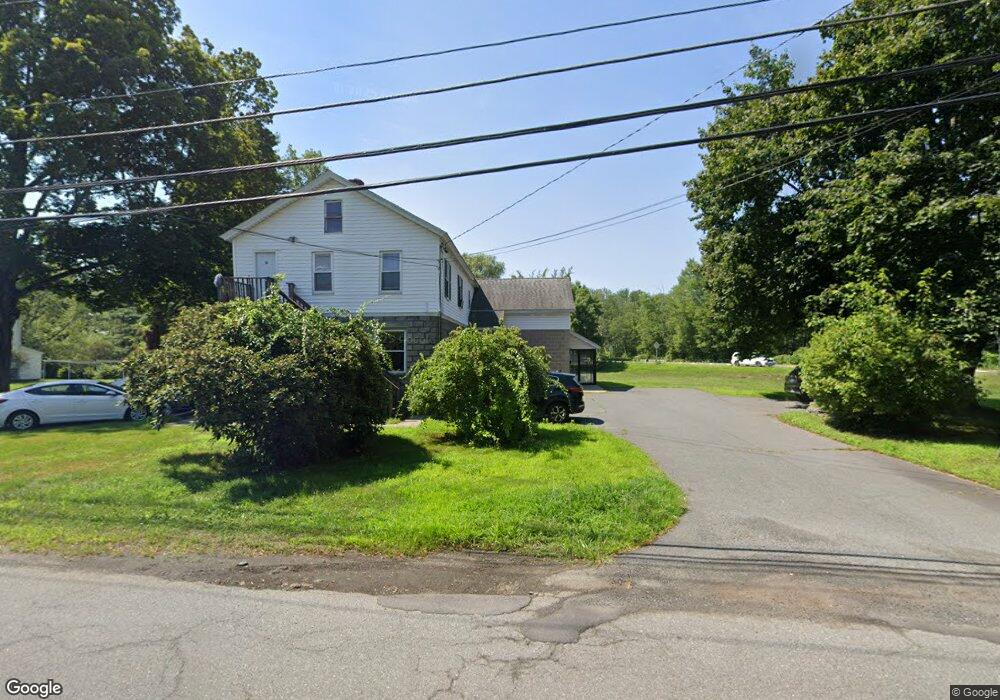
43 Conway St South Deerfield, MA 01373
Estimated Value: $420,157
7
Beds
4
Baths
3,180
Sq Ft
$132/Sq Ft
Est. Value
About This Home
This home is located at 43 Conway St, South Deerfield, MA 01373 and is currently estimated at $420,157, approximately $132 per square foot. 43 Conway St is a home located in Franklin County with nearby schools including Deerfield Elementary School, Frontier Regional School, and The Bement School.
Ownership History
Date
Name
Owned For
Owner Type
Purchase Details
Closed on
Jun 28, 2021
Sold by
Allis Paul W and Allis Brickett
Bought by
Petersen Jessica E
Current Estimated Value
Home Financials for this Owner
Home Financials are based on the most recent Mortgage that was taken out on this home.
Original Mortgage
$263,200
Outstanding Balance
$237,775
Interest Rate
2.9%
Mortgage Type
Commercial
Estimated Equity
$182,382
Purchase Details
Closed on
Jul 5, 2006
Sold by
Chen Ted Tl and Chen Marian W
Bought by
Allis Paul W
Home Financials for this Owner
Home Financials are based on the most recent Mortgage that was taken out on this home.
Original Mortgage
$241,200
Interest Rate
6.6%
Mortgage Type
Commercial
Create a Home Valuation Report for This Property
The Home Valuation Report is an in-depth analysis detailing your home's value as well as a comparison with similar homes in the area
Home Values in the Area
Average Home Value in this Area
Purchase History
| Date | Buyer | Sale Price | Title Company |
|---|---|---|---|
| Petersen Jessica E | $329,000 | None Available | |
| Allis Paul W | $268,000 | -- |
Source: Public Records
Mortgage History
| Date | Status | Borrower | Loan Amount |
|---|---|---|---|
| Open | Petersen Jessica E | $263,200 | |
| Previous Owner | Allis Paul W | $241,200 |
Source: Public Records
Tax History Compared to Growth
Tax History
| Year | Tax Paid | Tax Assessment Tax Assessment Total Assessment is a certain percentage of the fair market value that is determined by local assessors to be the total taxable value of land and additions on the property. | Land | Improvement |
|---|---|---|---|---|
| 2025 | $5,696 | $429,900 | $156,200 | $273,700 |
| 2024 | $5,622 | $405,900 | $144,200 | $261,700 |
| 2023 | $5,702 | $380,900 | $128,200 | $252,700 |
| 2022 | $5,507 | $363,000 | $122,200 | $240,800 |
| 2021 | $5,223 | $329,500 | $116,200 | $213,300 |
| 2020 | $5,044 | $321,500 | $108,200 | $213,300 |
| 2019 | $4,811 | $302,399 | $108,200 | $194,199 |
| 2018 | $4,600 | $288,400 | $104,200 | $184,200 |
| 2017 | $4,566 | $296,499 | $104,200 | $192,299 |
| 2016 | $4,705 | $308,500 | $100,200 | $208,300 |
| 2015 | $4,549 | $304,500 | $96,200 | $208,300 |
Source: Public Records
Map
Nearby Homes
- 24 Elm St
- 24 Graves St
- 33 Eastern Ave
- 13 Capt Lathrop Dr
- 40 Eastern Ave
- 15 Crestview Dr
- Lot C Mountain Rd
- Lot A Mountain Rd
- Lot B Mountain Rd
- 208 Greenfield Rd
- 7 Stage Rd
- 238 N Main St
- 0 Pocumtuck Dr Unit 73379330
- 30 Lee Rd
- 345 Greenfield Rd
- 32 Swamp Rd
- 110 Old Amherst Rd
- 134 Montague Rd
- 146 Old Amherst Rd
- 71 Mathews Rd