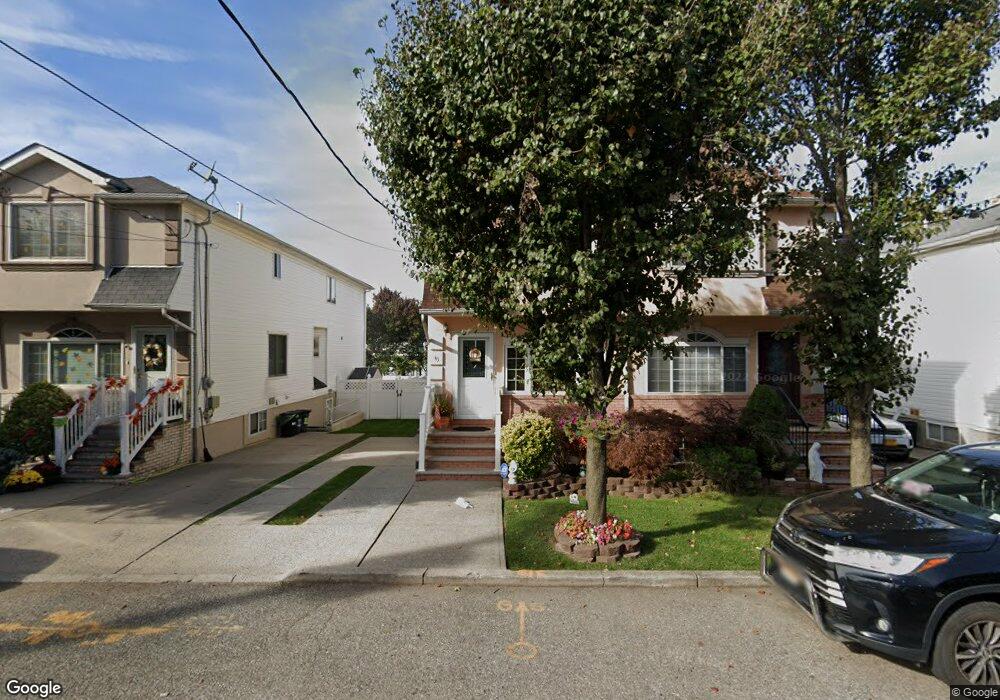
43 Crabtree Ave Unit Building Staten Island, NY 10309
Rossville NeighborhoodEstimated Value: $769,000 - $827,000
--
Bed
4
Baths
1,557
Sq Ft
$509/Sq Ft
Est. Value
About This Home
This home is located at 43 Crabtree Ave Unit Building, Staten Island, NY 10309 and is currently estimated at $793,036, approximately $509 per square foot. 43 Crabtree Ave Unit Building is a home located in Richmond County with nearby schools including Kathleen Grimm School For Leadership, P.S. 56 - The Louis Desario School, and Is 34 Tottenville.
Ownership History
Date
Name
Owned For
Owner Type
Purchase Details
Closed on
Dec 15, 2023
Sold by
Temkin Howard and Temkin Esta
Bought by
Ayob Gena
Current Estimated Value
Home Financials for this Owner
Home Financials are based on the most recent Mortgage that was taken out on this home.
Original Mortgage
$531,000
Outstanding Balance
$521,825
Interest Rate
7.29%
Mortgage Type
New Conventional
Estimated Equity
$271,211
Purchase Details
Closed on
Aug 29, 2002
Sold by
New Vision Properties Llc
Bought by
Temkin Howard and Temkin Esta
Home Financials for this Owner
Home Financials are based on the most recent Mortgage that was taken out on this home.
Original Mortgage
$180,000
Interest Rate
6.16%
Mortgage Type
Purchase Money Mortgage
Create a Home Valuation Report for This Property
The Home Valuation Report is an in-depth analysis detailing your home's value as well as a comparison with similar homes in the area
Home Values in the Area
Average Home Value in this Area
Purchase History
| Date | Buyer | Sale Price | Title Company |
|---|---|---|---|
| Ayob Gena | $708,000 | Wfg National Title | |
| Temkin Howard | $330,000 | First American Title Ins Co |
Source: Public Records
Mortgage History
| Date | Status | Borrower | Loan Amount |
|---|---|---|---|
| Open | Ayob Gena | $531,000 | |
| Previous Owner | Temkin Howard | $180,000 |
Source: Public Records
Tax History Compared to Growth
Tax History
| Year | Tax Paid | Tax Assessment Tax Assessment Total Assessment is a certain percentage of the fair market value that is determined by local assessors to be the total taxable value of land and additions on the property. | Land | Improvement |
|---|---|---|---|---|
| 2025 | $7,250 | $42,840 | $8,332 | $34,508 |
| 2024 | $7,531 | $41,220 | $8,242 | $32,978 |
| 2023 | $7,331 | $37,498 | $7,941 | $29,557 |
| 2022 | $6,980 | $39,060 | $9,060 | $30,000 |
| 2021 | $6,925 | $37,560 | $9,060 | $28,500 |
| 2020 | $6,654 | $36,660 | $9,060 | $27,600 |
| 2019 | $6,244 | $35,100 | $9,060 | $26,040 |
| 2018 | $6,072 | $31,248 | $8,579 | $22,669 |
| 2017 | $5,885 | $30,337 | $8,964 | $21,373 |
| 2016 | $5,412 | $28,620 | $9,060 | $19,560 |
| 2015 | $4,692 | $27,360 | $7,560 | $19,800 |
| 2014 | $4,692 | $26,040 | $7,560 | $18,480 |
Source: Public Records
Map
Nearby Homes
- 30 Harris Ln
- 16 Harris Ln
- 18 Harris Ln
- 24 Harris Ln
- 669 Bloomingdale Rd
- 119 Berkshire Ln
- 122 Clay Pit Rd
- 0 Veterans Rd E
- 126 Lorraine Loop
- 816 Bloomingdale Rd
- 15 Wiltshire Ln
- 42 Spruce Ln
- 298 Kramer Ave
- 33 White Oak Ln
- 102 Lorraine Loop
- 137 Shiel Ave
- 62 Dexter Ave
- 729 Correll Ave
- 34 Lorraine Loop
- 11 Jessica Ln
- 43 Crabtree Ave
- 41 Crabtree Ave
- 47 Crabtree Ave
- 37 Crabtree Ave
- 49 Crabtree Ave
- 35 Crabtree Ave
- 31 Crabtree Ave
- 0 Crabtree Ave Unit 2 1096882
- 0 Crabtree Ave
- 49 Harris Ln
- 49 Harris Ln Unit 1
- 47 Harris Ln
- 29 Crabtree Ave
- 53 Harris Ln
- 43 Harris Ln
- 105 Harris Ln
- 111 Harris Ln
- 103 Harris Ln
- 55 Harris Ln
- 99 Harris Ln