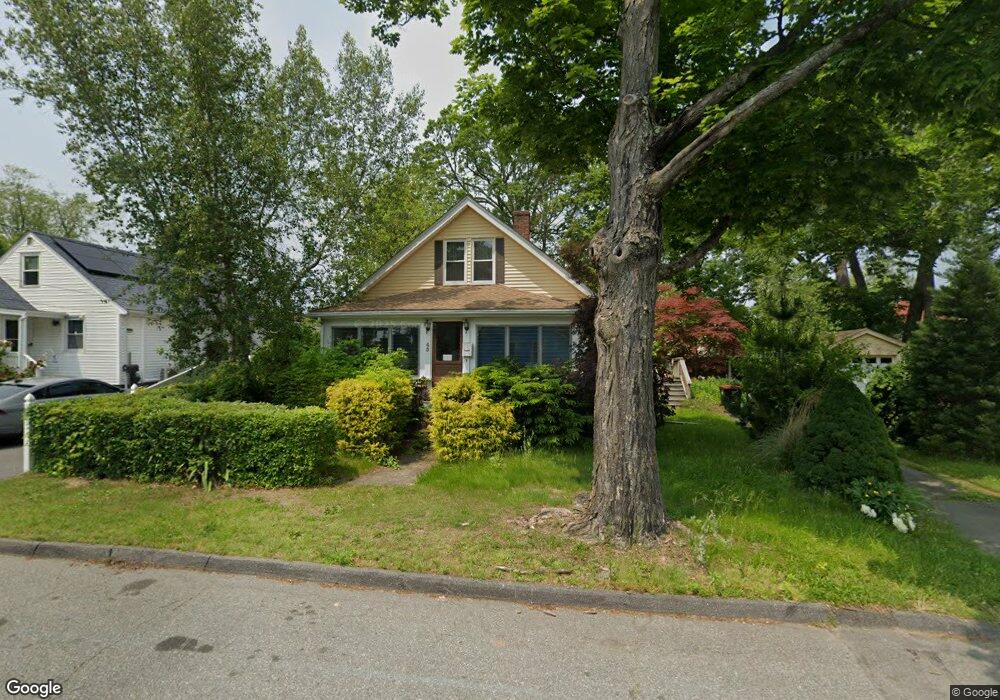
43 Custer St Brockton, MA 02301
Clifton Heights NeighborhoodEstimated Value: $392,000 - $477,000
3
Beds
1
Bath
1,261
Sq Ft
$351/Sq Ft
Est. Value
About This Home
This home is located at 43 Custer St, Brockton, MA 02301 and is currently estimated at $443,136, approximately $351 per square foot. 43 Custer St is a home located in Plymouth County with nearby schools including Gilmore Elementary School, John F. Kennedy Elementary School, and Davis K-8 School.
Ownership History
Date
Name
Owned For
Owner Type
Purchase Details
Closed on
Nov 20, 2025
Sold by
Rutkauskas Francis J and Rutkauskas Jo A
Bought by
Franjo T T and Franjo Rutkauskas
Current Estimated Value
Purchase Details
Closed on
Sep 14, 1989
Sold by
Reardon Janet B
Bought by
Rutkauskas Francis J
Create a Home Valuation Report for This Property
The Home Valuation Report is an in-depth analysis detailing your home's value as well as a comparison with similar homes in the area
Home Values in the Area
Average Home Value in this Area
Purchase History
| Date | Buyer | Sale Price | Title Company |
|---|---|---|---|
| Franjo T T | -- | -- | |
| Rutkauskas Francis J | $122,000 | -- | |
| Rutkauskas Francis J | $122,000 | -- |
Source: Public Records
Mortgage History
| Date | Status | Borrower | Loan Amount |
|---|---|---|---|
| Previous Owner | Rutkauskas Francis J | $75,000 | |
| Previous Owner | Rutkauskas Francis J | $102,000 | |
| Previous Owner | Rutkauskas Francis J | $103,400 | |
| Previous Owner | Rutkauskas Francis J | $104,000 |
Source: Public Records
Tax History
| Year | Tax Paid | Tax Assessment Tax Assessment Total Assessment is a certain percentage of the fair market value that is determined by local assessors to be the total taxable value of land and additions on the property. | Land | Improvement |
|---|---|---|---|---|
| 2025 | $4,366 | $360,500 | $140,400 | $220,100 |
| 2024 | $4,284 | $356,400 | $140,400 | $216,000 |
| 2023 | $4,120 | $317,400 | $105,800 | $211,600 |
| 2022 | $4,178 | $299,100 | $96,200 | $202,900 |
| 2021 | $3,927 | $270,800 | $80,300 | $190,500 |
| 2020 | $3,728 | $246,100 | $74,900 | $171,200 |
| 2019 | $3,503 | $225,400 | $72,900 | $152,500 |
| 2018 | $3,300 | $205,500 | $72,900 | $132,600 |
| 2017 | $3,009 | $186,900 | $72,900 | $114,000 |
| 2016 | $2,939 | $169,300 | $70,800 | $98,500 |
| 2015 | $2,768 | $152,500 | $70,800 | $81,700 |
| 2014 | $2,660 | $146,700 | $70,800 | $75,900 |
Source: Public Records
Map
Nearby Homes
Your Personal Tour Guide
Ask me questions while you tour the home.