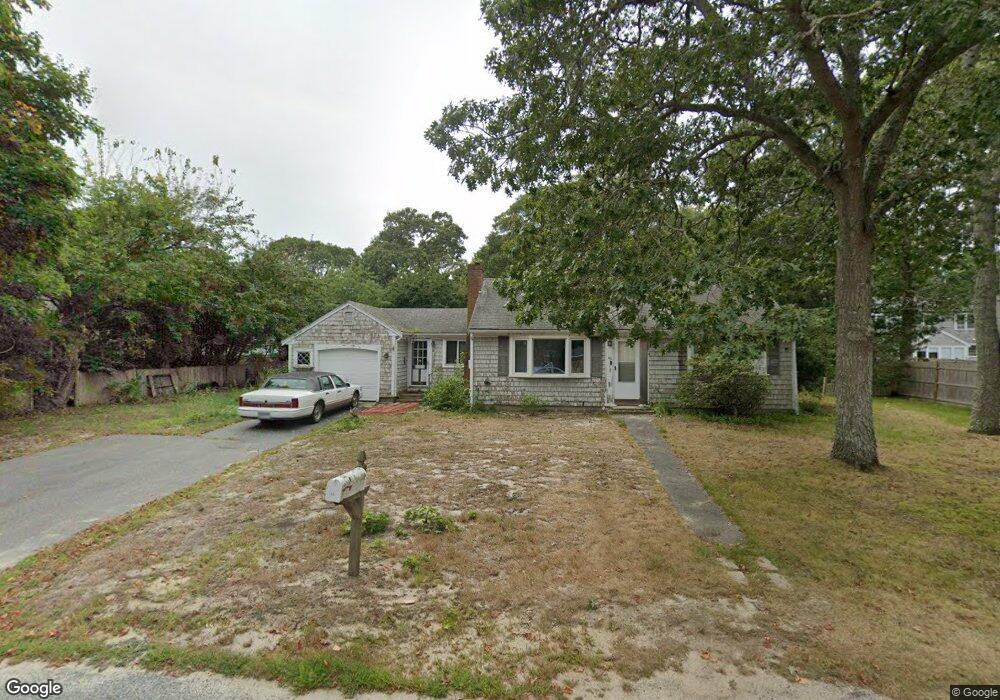
43 Davis Rd South Yarmouth, MA 02664
Estimated Value: $533,269 - $589,000
3
Beds
2
Baths
1,222
Sq Ft
$450/Sq Ft
Est. Value
About This Home
This home is located at 43 Davis Rd, South Yarmouth, MA 02664 and is currently estimated at $550,067, approximately $450 per square foot. 43 Davis Rd is a home located in Barnstable County with nearby schools including Dennis-Yarmouth Regional High School and St. Pius X. School.
Ownership History
Date
Name
Owned For
Owner Type
Purchase Details
Closed on
Feb 25, 2008
Sold by
Gonci Albert A and Guardo Lorraine G
Bought by
Daffinee Karen A
Current Estimated Value
Home Financials for this Owner
Home Financials are based on the most recent Mortgage that was taken out on this home.
Original Mortgage
$184,500
Outstanding Balance
$115,924
Interest Rate
5.9%
Mortgage Type
Purchase Money Mortgage
Estimated Equity
$434,143
Create a Home Valuation Report for This Property
The Home Valuation Report is an in-depth analysis detailing your home's value as well as a comparison with similar homes in the area
Home Values in the Area
Average Home Value in this Area
Purchase History
| Date | Buyer | Sale Price | Title Company |
|---|---|---|---|
| Daffinee Karen A | $244,000 | -- |
Source: Public Records
Mortgage History
| Date | Status | Borrower | Loan Amount |
|---|---|---|---|
| Open | Daffinee Karen A | $184,500 |
Source: Public Records
Tax History Compared to Growth
Tax History
| Year | Tax Paid | Tax Assessment Tax Assessment Total Assessment is a certain percentage of the fair market value that is determined by local assessors to be the total taxable value of land and additions on the property. | Land | Improvement |
|---|---|---|---|---|
| 2025 | $3,022 | $426,900 | $165,000 | $261,900 |
| 2024 | $2,835 | $384,200 | $143,500 | $240,700 |
| 2023 | $2,864 | $353,100 | $130,400 | $222,700 |
| 2022 | $2,821 | $307,300 | $124,500 | $182,800 |
| 2021 | $2,672 | $279,500 | $124,500 | $155,000 |
| 2020 | $2,702 | $270,200 | $131,800 | $138,400 |
| 2019 | $2,640 | $261,400 | $131,800 | $129,600 |
| 2018 | $2,463 | $239,400 | $109,800 | $129,600 |
| 2017 | $2,399 | $239,400 | $109,800 | $129,600 |
| 2016 | $2,301 | $230,600 | $101,000 | $129,600 |
| 2015 | $2,163 | $215,400 | $96,600 | $118,800 |
Source: Public Records
Map
Nearby Homes