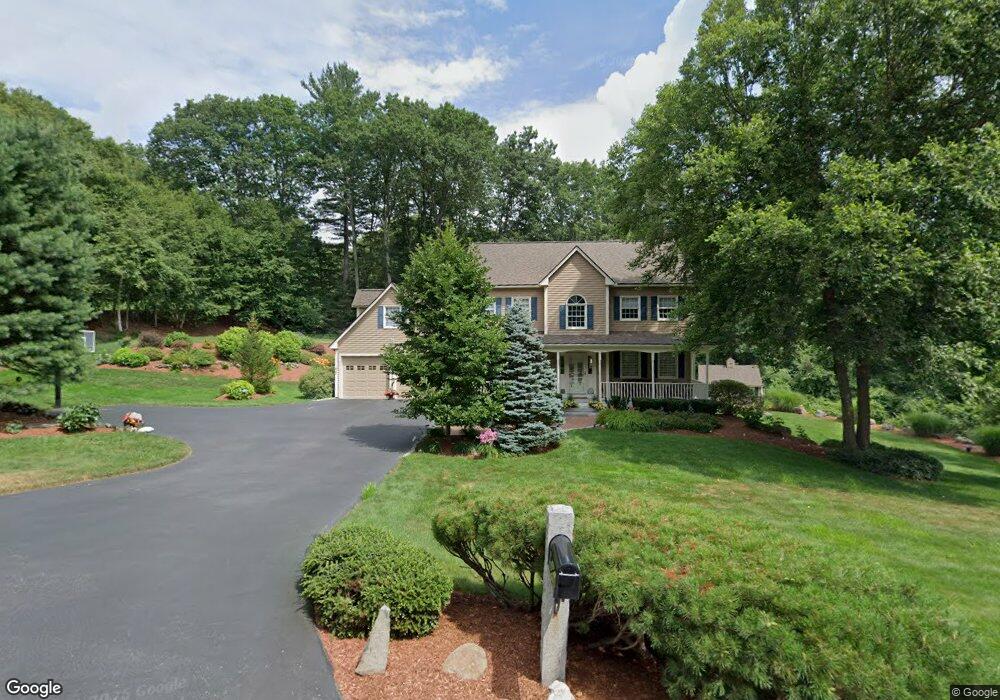
43 Deacon Ln Hollis, NH 03049
Hollis NeighborhoodEstimated Value: $720,000 - $951,000
4
Beds
3
Baths
2,825
Sq Ft
$309/Sq Ft
Est. Value
About This Home
This home is located at 43 Deacon Ln, Hollis, NH 03049 and is currently estimated at $871,997, approximately $308 per square foot. 43 Deacon Ln is a home with nearby schools including Hollis Primary School, Hollis Upper Elementary School, and Hollis-Brookline Middle School.
Ownership History
Date
Name
Owned For
Owner Type
Purchase Details
Closed on
Apr 28, 2017
Sold by
Fox Fox C and Fox Janet C
Bought by
Fox Joint Ret
Current Estimated Value
Purchase Details
Closed on
Jul 17, 2001
Sold by
Stanza Inc
Bought by
Fox Fox C and Fox Janet C
Home Financials for this Owner
Home Financials are based on the most recent Mortgage that was taken out on this home.
Original Mortgage
$245,000
Interest Rate
7.2%
Create a Home Valuation Report for This Property
The Home Valuation Report is an in-depth analysis detailing your home's value as well as a comparison with similar homes in the area
Home Values in the Area
Average Home Value in this Area
Purchase History
| Date | Buyer | Sale Price | Title Company |
|---|---|---|---|
| Fox Joint Ret | -- | -- | |
| Fox Fox C | $389,000 | -- |
Source: Public Records
Mortgage History
| Date | Status | Borrower | Loan Amount |
|---|---|---|---|
| Previous Owner | Fox Fox C | $250,000 | |
| Previous Owner | Fox Fox C | $220,000 | |
| Previous Owner | Fox Fox C | $155,000 | |
| Previous Owner | Fox Fox C | $245,000 |
Source: Public Records
Tax History Compared to Growth
Tax History
| Year | Tax Paid | Tax Assessment Tax Assessment Total Assessment is a certain percentage of the fair market value that is determined by local assessors to be the total taxable value of land and additions on the property. | Land | Improvement |
|---|---|---|---|---|
| 2024 | $12,759 | $719,600 | $280,000 | $439,600 |
| 2023 | $11,989 | $719,600 | $280,000 | $439,600 |
| 2022 | $16,241 | $719,600 | $280,000 | $439,600 |
| 2021 | $10,562 | $465,300 | $183,000 | $282,300 |
| 2020 | $19,976 | $465,300 | $183,000 | $282,300 |
| 2019 | $10,748 | $465,300 | $183,000 | $282,300 |
| 2018 | $10,083 | $465,300 | $183,000 | $282,300 |
| 2017 | $9,959 | $430,200 | $171,200 | $259,000 |
| 2016 | $10,080 | $430,200 | $171,200 | $259,000 |
| 2015 | $9,903 | $430,200 | $171,200 | $259,000 |
| 2014 | $9,951 | $430,200 | $171,200 | $259,000 |
| 2013 | $9,817 | $430,200 | $171,200 | $259,000 |
Source: Public Records
Map
Nearby Homes