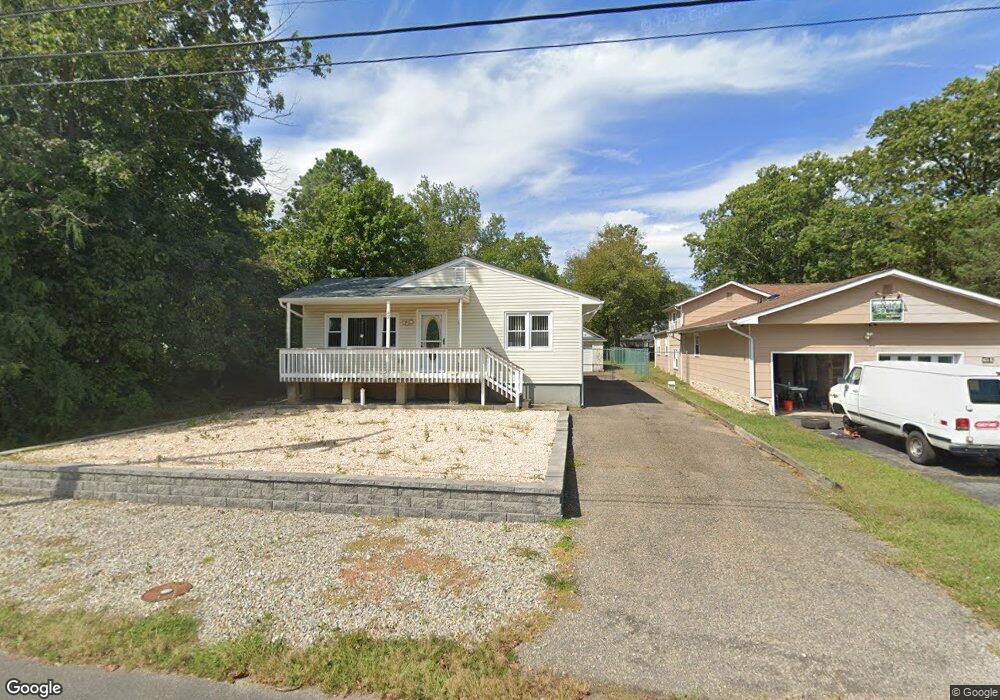
43 E 3rd St Howell, NJ 07731
Adelphia NeighborhoodEstimated Value: $393,882 - $452,000
3
Beds
1
Bath
1,148
Sq Ft
$373/Sq Ft
Est. Value
About This Home
This home is located at 43 E 3rd St, Howell, NJ 07731 and is currently estimated at $428,721, approximately $373 per square foot. 43 E 3rd St is a home located in Monmouth County with nearby schools including Land O' Pines School, Newbury School, and Howell Middle School North.
Ownership History
Date
Name
Owned For
Owner Type
Purchase Details
Closed on
Sep 8, 2003
Sold by
Ruscus Robert
Bought by
Mazzacuva Pasquale
Current Estimated Value
Home Financials for this Owner
Home Financials are based on the most recent Mortgage that was taken out on this home.
Original Mortgage
$139,000
Outstanding Balance
$64,083
Interest Rate
6.15%
Estimated Equity
$364,638
Purchase Details
Closed on
Sep 19, 1996
Sold by
Garofalo Anthony
Bought by
Ruscus Robert and Ruscus Deborah
Home Financials for this Owner
Home Financials are based on the most recent Mortgage that was taken out on this home.
Original Mortgage
$80,000
Interest Rate
7.9%
Purchase Details
Closed on
Dec 8, 1995
Sold by
Dodds Zina
Bought by
Garofalo Anthony
Home Financials for this Owner
Home Financials are based on the most recent Mortgage that was taken out on this home.
Original Mortgage
$40,000
Interest Rate
7.34%
Create a Home Valuation Report for This Property
The Home Valuation Report is an in-depth analysis detailing your home's value as well as a comparison with similar homes in the area
Home Values in the Area
Average Home Value in this Area
Purchase History
| Date | Buyer | Sale Price | Title Company |
|---|---|---|---|
| Mazzacuva Pasquale | $179,888 | -- | |
| Ruscus Robert | $78,000 | -- | |
| Garofalo Anthony | $48,200 | -- |
Source: Public Records
Mortgage History
| Date | Status | Borrower | Loan Amount |
|---|---|---|---|
| Open | Mazzacuva Pasquale | $139,000 | |
| Previous Owner | Ruscus Robert | $80,000 | |
| Previous Owner | Garofalo Anthony | $40,000 |
Source: Public Records
Tax History
| Year | Tax Paid | Tax Assessment Tax Assessment Total Assessment is a certain percentage of the fair market value that is determined by local assessors to be the total taxable value of land and additions on the property. | Land | Improvement |
|---|---|---|---|---|
| 2025 | $5,781 | $358,300 | $216,500 | $141,800 |
| 2024 | $5,351 | $325,700 | $186,500 | $139,200 |
Source: Public Records
Map
Nearby Homes
- 45 E 3rd St
- 164 Roosevelt Ave
- 42 E 2nd St
- 35 E 3rd St
- 44 E 2nd St
- 168 Roosevelt Ave
- 42 E 3rd St
- 172 Roosevelt Ave
- 48 E 3rd St
- 163 Roosevelt Ave
- 167 Roosevelt Ave
- 156 Roosevelt Ave
- 156 Roosevelt Ave Unit 3
- 50 E 2nd St
- 52 E 3rd St
- 38 E 2nd St
- 67 Frederick Ave
- 152 Roosevelt Ave
- 27 E 3rd St
- 71 Frederick Ave
Your Personal Tour Guide
Ask me questions while you tour the home.