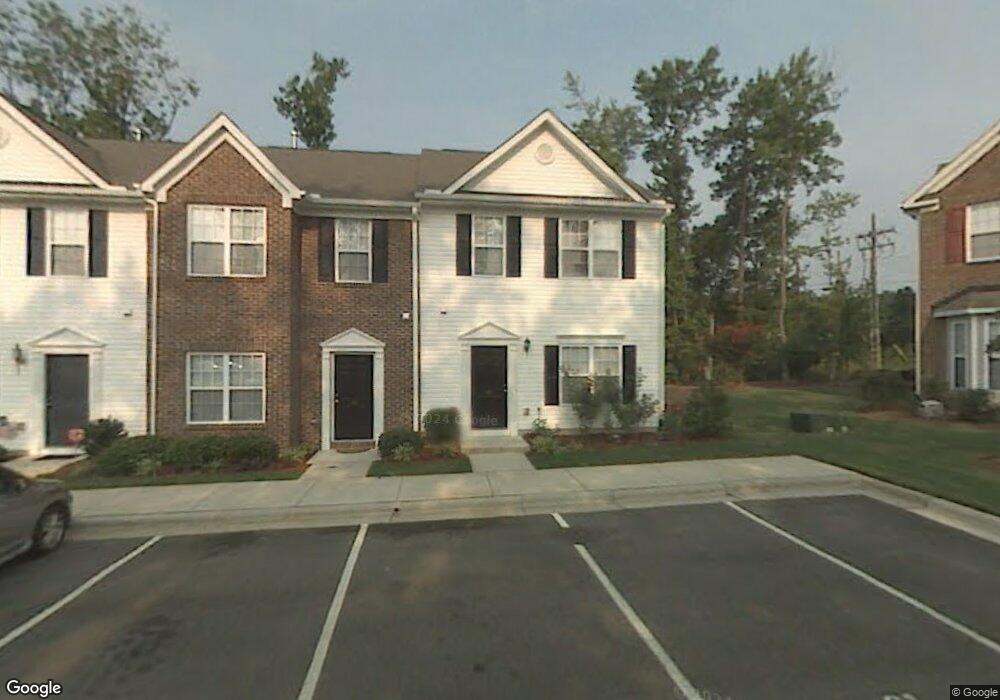
43 Edgebrook Cir Durham, NC 27703
Bethesda NeighborhoodEstimated Value: $265,000 - $296,000
3
Beds
3
Baths
1,440
Sq Ft
$196/Sq Ft
Est. Value
About This Home
This home is located at 43 Edgebrook Cir, Durham, NC 27703 and is currently estimated at $282,349, approximately $196 per square foot. 43 Edgebrook Cir is a home located in Durham County with nearby schools including Bethesda Elementary School, John W Neal Middle School, and Southern School of Energy & Sustainability.
Ownership History
Date
Name
Owned For
Owner Type
Purchase Details
Closed on
Jul 28, 2020
Sold by
Langley Dawn E
Bought by
Vonwald Ian
Current Estimated Value
Home Financials for this Owner
Home Financials are based on the most recent Mortgage that was taken out on this home.
Original Mortgage
$184,300
Outstanding Balance
$164,088
Interest Rate
3.2%
Mortgage Type
New Conventional
Estimated Equity
$118,261
Purchase Details
Closed on
Jun 17, 2015
Sold by
Powers Jeremiah D and Powers Brooke
Bought by
Langley Dawn E
Home Financials for this Owner
Home Financials are based on the most recent Mortgage that was taken out on this home.
Original Mortgage
$133,536
Interest Rate
3.75%
Mortgage Type
FHA
Purchase Details
Closed on
Feb 26, 2004
Sold by
The New Fortis Corp
Bought by
Powers Jeremiah D and Powers Brooke
Home Financials for this Owner
Home Financials are based on the most recent Mortgage that was taken out on this home.
Original Mortgage
$104,950
Interest Rate
4.75%
Mortgage Type
Purchase Money Mortgage
Purchase Details
Closed on
Aug 6, 2003
Sold by
Ellis Ventures Llc
Bought by
The New Fortis Corp
Create a Home Valuation Report for This Property
The Home Valuation Report is an in-depth analysis detailing your home's value as well as a comparison with similar homes in the area
Home Values in the Area
Average Home Value in this Area
Purchase History
| Date | Buyer | Sale Price | Title Company |
|---|---|---|---|
| Vonwald Ian | $190,000 | None Available | |
| Langley Dawn E | $136,000 | None Available | |
| Powers Jeremiah D | $131,500 | -- | |
| The New Fortis Corp | $259,500 | -- |
Source: Public Records
Mortgage History
| Date | Status | Borrower | Loan Amount |
|---|---|---|---|
| Open | Vonwald Ian | $184,300 | |
| Previous Owner | Langley Dawn E | $133,536 | |
| Previous Owner | Powers Jeremiah D | $104,950 | |
| Closed | Powers Jeremiah D | $26,200 |
Source: Public Records
Tax History
| Year | Tax Paid | Tax Assessment Tax Assessment Total Assessment is a certain percentage of the fair market value that is determined by local assessors to be the total taxable value of land and additions on the property. | Land | Improvement |
|---|---|---|---|---|
| 2025 | $2,928 | $295,349 | $75,000 | $220,349 |
| 2024 | $2,277 | $163,239 | $40,000 | $123,239 |
| 2023 | $2,138 | $163,239 | $40,000 | $123,239 |
| 2022 | $2,089 | $163,239 | $40,000 | $123,239 |
| 2021 | $2,080 | $163,239 | $40,000 | $123,239 |
| 2020 | $2,031 | $163,239 | $40,000 | $123,239 |
| 2019 | $2,031 | $163,239 | $40,000 | $123,239 |
| 2018 | $1,936 | $142,701 | $32,000 | $110,701 |
| 2017 | $1,921 | $142,701 | $32,000 | $110,701 |
| 2016 | $1,857 | $142,701 | $32,000 | $110,701 |
| 2015 | $2,022 | $146,091 | $33,000 | $113,091 |
| 2014 | -- | $146,091 | $33,000 | $113,091 |
Source: Public Records
Map
Nearby Homes
- 31 Edgebrook Cir
- 1118 Commack Dr
- 1042 Commack Dr
- 1116 Freeport Dr Unit 156
- 3908 Cash Rd
- 2217 S Miami Blvd
- 2524 Rolling Pines Ave
- 2520 Rolling Pines Ave
- 1017 Depot Dr
- 1012 Depot Dr
- 4213 Congleton Place
- 1200 Bluewater Way
- 1923 Hinesley Dr
- 111 Lang St
- 3112 Ranger Dr
- 1222 Flyfish Ave
- 727A Peyton Ave
- 3105 Ranger Dr
- 3857 Angier Ave
- 1936 Hinesley Dr
- 41 Edgebrook Cir
- 39 Edgebrook Cir
- 37 Edgebrook Cir
- 40 Edgebrook Cir
- 38 Edgebrook Cir
- 29 Edgebrook Cir
- 36 Edgebrook Cir
- 27 Edgebrook Cir
- 25 Edgebrook Cir
- 34 Edgebrook Cir
- 23 Edgebrook Cir
- 21 Edgebrook Cir
- 28 Edgebrook Cir
- 26 Edgebrook Cir
- 24 Edgebrook Cir
- 22 Edgebrook Cir
- 2621 Ellis Rd Unit JOE
- 17 Edgebrook Cir
- 20 Edgebrook Cir
- 15 Edgebrook Cir
Your Personal Tour Guide
Ask me questions while you tour the home.