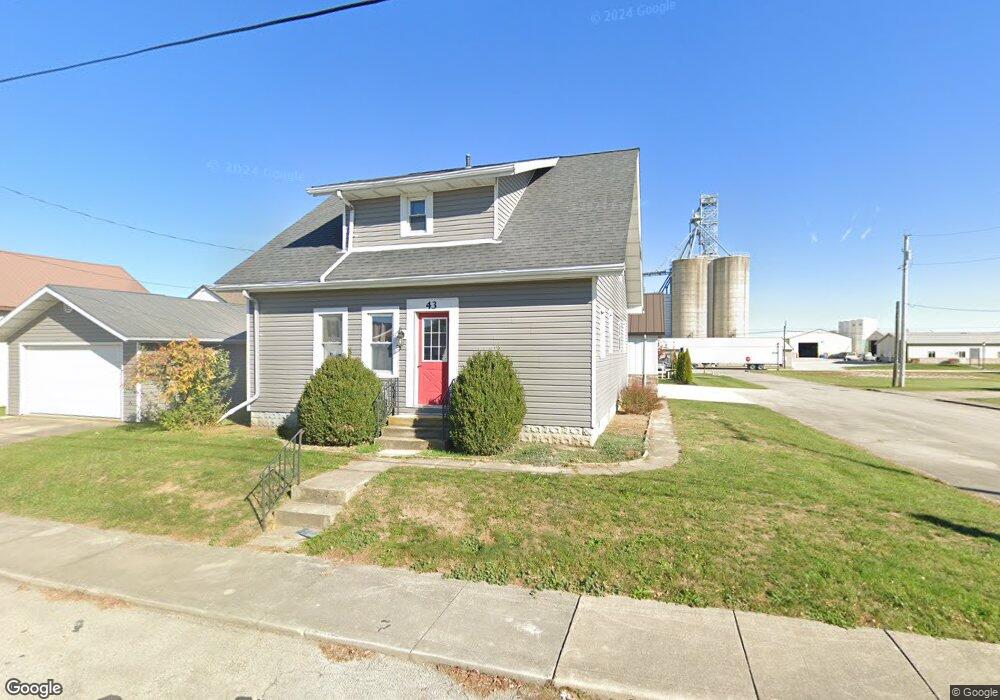
43 Elm St Osgood, OH 45351
Estimated Value: $187,000 - $237,854
3
Beds
1
Bath
1,411
Sq Ft
$150/Sq Ft
Est. Value
About This Home
This home is located at 43 Elm St, Osgood, OH 45351 and is currently estimated at $211,964, approximately $150 per square foot. 43 Elm St is a home with nearby schools including Marion Local Elementary School and Marion Local High School.
Ownership History
Date
Name
Owned For
Owner Type
Purchase Details
Closed on
Nov 15, 2023
Sold by
Barlage Andrew L and Barlage Shawntel M
Current Estimated Value
Purchase Details
Closed on
Sep 23, 2020
Sold by
Pleiman Andrew M
Bought by
Barlage Andrew L and Barlage Shawntel M
Home Financials for this Owner
Home Financials are based on the most recent Mortgage that was taken out on this home.
Original Mortgage
$121,754
Interest Rate
2.9%
Mortgage Type
Future Advance Clause Open End Mortgage
Purchase Details
Closed on
May 19, 2009
Sold by
Folkerth Janet M A
Bought by
Pleiman Andrew M
Home Financials for this Owner
Home Financials are based on the most recent Mortgage that was taken out on this home.
Original Mortgage
$37,274
Interest Rate
4.83%
Mortgage Type
Future Advance Clause Open End Mortgage
Create a Home Valuation Report for This Property
The Home Valuation Report is an in-depth analysis detailing your home's value as well as a comparison with similar homes in the area
Home Values in the Area
Average Home Value in this Area
Purchase History
| Date | Buyer | Sale Price | Title Company |
|---|---|---|---|
| -- | $220,000 | None Listed On Document | |
| Barlage Andrew L | $124,000 | Republic Title Agency Inc | |
| Pleiman Andrew M | $46,000 | None Available |
Source: Public Records
Mortgage History
| Date | Status | Borrower | Loan Amount |
|---|---|---|---|
| Previous Owner | Barlage Andrew L | $121,754 | |
| Previous Owner | Pleiman Andrew M | $37,274 |
Source: Public Records
Tax History Compared to Growth
Tax History
| Year | Tax Paid | Tax Assessment Tax Assessment Total Assessment is a certain percentage of the fair market value that is determined by local assessors to be the total taxable value of land and additions on the property. | Land | Improvement |
|---|---|---|---|---|
| 2024 | $2,699 | $72,250 | $4,220 | $68,030 |
| 2023 | $1,670 | $44,650 | $4,220 | $40,430 |
| 2022 | $1,534 | $39,960 | $3,580 | $36,380 |
| 2021 | $1,563 | $39,960 | $3,580 | $36,380 |
| 2020 | $970 | $24,710 | $3,580 | $21,130 |
| 2019 | $817 | $20,480 | $3,580 | $16,900 |
| 2018 | $853 | $20,480 | $3,580 | $16,900 |
| 2017 | $862 | $20,480 | $3,580 | $16,900 |
| 2016 | $850 | $20,800 | $3,590 | $17,210 |
| 2015 | $850 | $20,800 | $3,590 | $17,210 |
| 2014 | $851 | $20,800 | $3,590 | $17,210 |
| 2013 | $884 | $19,230 | $3,590 | $15,640 |
Source: Public Records
Map
Nearby Homes