
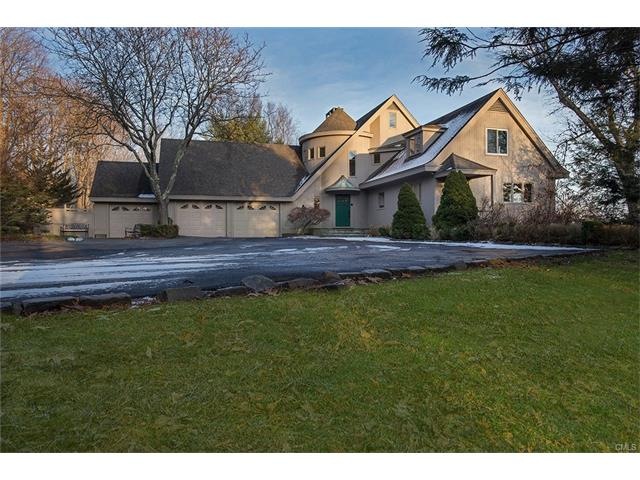
43 Farview Farm Rd Redding, CT 06896
5
Beds
4
Baths
5,640
Sq Ft
2.61
Acres
Highlights
- Colonial Architecture
- Deck
- 3 Fireplaces
- Redding Elementary School Rated A
- Attic
- Community Pool
About This Home
As of May 2019A spectacular opportunity for a great home on a killer lot with views in sought-after Farview Farms. This special residence includes a beautiful entry; living rm w/fireplace, window seats and great views from picture window; spacious kitchen; main level master suite with sitting room; gorgeous den with fireplace and views as well; wine cellar; new furnace; fresh exterior painting; new master bath 2011; new A/C condenser 2015; on a clear day views of Long Island Sound!! Located in sought after Farview Farms w/clubhouse, pool, tennis courts, etc. Assoc. Fees $995 per quarter.
Last Agent to Sell the Property
Chip Neumann
Houlihan Lawrence License #RES.0496077 Listed on: 01/17/2017
Home Details
Home Type
- Single Family
Est. Annual Taxes
- $22,565
Year Built
- Built in 1980
Lot Details
- 2.61 Acre Lot
- Property is zoned Res.
Home Design
- Colonial Architecture
- Concrete Foundation
- Frame Construction
- Asphalt Shingled Roof
- Wood Siding
Interior Spaces
- 3 Fireplaces
- Home Security System
- Attic
Kitchen
- Built-In Oven
- Cooktop
- Dishwasher
Bedrooms and Bathrooms
- 5 Bedrooms
- 4 Full Bathrooms
Laundry
- Dryer
- Washer
Finished Basement
- Walk-Out Basement
- Basement Fills Entire Space Under The House
- Interior Basement Entry
- Basement Storage
Parking
- 4 Car Attached Garage
- Parking Deck
Outdoor Features
- Deck
- Patio
Schools
- Redding Elementary School
- John Read Middle School
- Joel Barlow High School
Utilities
- Zoned Heating and Cooling
- Heating System Uses Oil
- Private Company Owned Well
- Fuel Tank Located in Basement
Community Details
Overview
- Property has a Home Owners Association
Recreation
- Tennis Courts
- Community Pool
Ownership History
Date
Name
Owned For
Owner Type
Purchase Details
Listed on
Aug 17, 2018
Closed on
May 16, 2019
Sold by
Ball John and Ball Sara
Bought by
Robertson Gerard and Robertson Kathleen M
Seller's Agent
Laura Ancona
William Pitt Sotheby's Int'l
Buyer's Agent
Gerry Nusbaum
Brown Harris Stevens
List Price
$775,000
Sold Price
$665,000
Premium/Discount to List
-$110,000
-14.19%
Total Days on Market
50
Current Estimated Value
Home Financials for this Owner
Home Financials are based on the most recent Mortgage that was taken out on this home.
Estimated Appreciation
$600,724
Avg. Annual Appreciation
10.41%
Original Mortgage
$598,500
Outstanding Balance
$530,567
Interest Rate
4.1%
Mortgage Type
Purchase Money Mortgage
Estimated Equity
$686,080
Purchase Details
Listed on
Jan 17, 2017
Closed on
Mar 13, 2017
Sold by
Mulberry Catherine M
Bought by
Ball John and Ball Sara
Seller's Agent
Chip Neumann
Houlihan Lawrence
Buyer's Agent
Doug Rose
Scalzo Real Estate
List Price
$749,000
Sold Price
$740,000
Premium/Discount to List
-$9,000
-1.2%
Home Financials for this Owner
Home Financials are based on the most recent Mortgage that was taken out on this home.
Avg. Annual Appreciation
-4.70%
Original Mortgage
$592,000
Interest Rate
4.19%
Mortgage Type
Purchase Money Mortgage
Purchase Details
Listed on
Jul 13, 2012
Closed on
Jul 16, 2012
Sold by
Mulberry Peter
Bought by
Mulberry Catherine M
Seller's Agent
Jan Jagush
Scalzo Real Estate
Buyer's Agent
JEFF S VARGOVCHIK
RE/MAX Right Choice
Sold Price
$3,800
Purchase Details
Closed on
Apr 29, 2005
Sold by
Pinter Mark and Pinter Colleen Zenk
Bought by
Mulberry Catherine M and Mulberry Peter
Home Financials for this Owner
Home Financials are based on the most recent Mortgage that was taken out on this home.
Original Mortgage
$1,000,000
Interest Rate
5.95%
Purchase Details
Closed on
Oct 1, 2001
Sold by
Valluzzo Johnv and Kasper Cynthia A
Bought by
Pinter Mark and Zenk-Pinter Colleen
Similar Homes in the area
Create a Home Valuation Report for This Property
The Home Valuation Report is an in-depth analysis detailing your home's value as well as a comparison with similar homes in the area
Home Values in the Area
Average Home Value in this Area
Purchase History
| Date | Type | Sale Price | Title Company |
|---|---|---|---|
| Warranty Deed | $665,000 | -- | |
| Warranty Deed | $740,000 | -- | |
| Quit Claim Deed | -- | -- | |
| Warranty Deed | $1,341,500 | -- | |
| Warranty Deed | $1,195,000 | -- |
Source: Public Records
Mortgage History
| Date | Status | Loan Amount | Loan Type |
|---|---|---|---|
| Open | $598,500 | Purchase Money Mortgage | |
| Previous Owner | $37,000 | Unknown | |
| Previous Owner | $111,000 | Unknown | |
| Previous Owner | $592,000 | Purchase Money Mortgage | |
| Previous Owner | $1,000,000 | No Value Available |
Source: Public Records
Property History
| Date | Event | Price | Change | Sq Ft Price |
|---|---|---|---|---|
| 05/29/2019 05/29/19 | Sold | $665,000 | -4.3% | $115 / Sq Ft |
| 05/27/2019 05/27/19 | Pending | -- | -- | -- |
| 03/07/2019 03/07/19 | Price Changed | $695,000 | -3.3% | $120 / Sq Ft |
| 02/08/2019 02/08/19 | Price Changed | $719,000 | -1.4% | $125 / Sq Ft |
| 01/10/2019 01/10/19 | Price Changed | $729,000 | -1.4% | $126 / Sq Ft |
| 12/03/2018 12/03/18 | Price Changed | $739,000 | -1.5% | $128 / Sq Ft |
| 10/03/2018 10/03/18 | Price Changed | $750,000 | -2.0% | $130 / Sq Ft |
| 09/14/2018 09/14/18 | Price Changed | $765,000 | -1.3% | $133 / Sq Ft |
| 08/17/2018 08/17/18 | For Sale | $775,000 | +4.7% | $134 / Sq Ft |
| 03/10/2017 03/10/17 | Sold | $740,000 | -1.2% | $131 / Sq Ft |
| 03/08/2017 03/08/17 | Pending | -- | -- | -- |
| 01/17/2017 01/17/17 | For Sale | $749,000 | 0.0% | $133 / Sq Ft |
| 07/13/2012 07/13/12 | For Rent | $3,900 | +2.6% | -- |
| 07/13/2012 07/13/12 | Rented | $3,800 | -- | -- |
Source: SmartMLS
Tax History Compared to Growth
Tax History
| Year | Tax Paid | Tax Assessment Tax Assessment Total Assessment is a certain percentage of the fair market value that is determined by local assessors to be the total taxable value of land and additions on the property. | Land | Improvement |
|---|---|---|---|---|
| 2024 | $22,878 | $796,600 | $190,300 | $606,300 |
| 2023 | $22,058 | $796,600 | $190,300 | $606,300 |
| 2022 | $17,504 | $525,000 | $217,500 | $307,500 |
| 2021 | $17,241 | $525,000 | $217,500 | $307,500 |
| 2020 | $17,241 | $525,000 | $217,500 | $307,500 |
| 2019 | $17,241 | $525,000 | $217,500 | $307,500 |
| 2018 | $21,934 | $691,500 | $217,500 | $474,000 |
| 2017 | $22,858 | $771,700 | $268,500 | $503,200 |
| 2016 | $22,565 | $771,700 | $268,500 | $503,200 |
| 2015 | $22,310 | $771,700 | $268,500 | $503,200 |
| 2014 | $22,310 | $771,700 | $268,500 | $503,200 |
Source: Public Records
Agents Affiliated with this Home
-
Laura Ancona
Seller's Agent in 2019
Laura Ancona
William Pitt
(203) 733-7053
79 in this area
247 Total Sales
-
Gerry Nusbaum
Buyer's Agent in 2019
Gerry Nusbaum
Brown Harris Stevens
(203) 219-1528
1 in this area
46 Total Sales
-
C
Seller's Agent in 2017
Chip Neumann
Houlihan Lawrence
(203) 731-1411
-
Doug Rose
Buyer's Agent in 2017
Doug Rose
Scalzo Real Estate
(203) 790-7077
82 Total Sales
-
Jan Jagush
J
Seller's Agent in 2012
Jan Jagush
Scalzo Real Estate
(203) 733-0712
19 Total Sales
-
J
Buyer's Agent in 2012
JEFF S VARGOVCHIK
RE/MAX
Map
Source: SmartMLS
MLS Number: 99171027
APN: REDD-000047-000000-000061
Disclaimer: Certain information contained herein is derived from information provided by parties other than Homes.com. All information provided is deemed reliable, but is not guaranteed to be accurate and should be independently verified.
![]() IDX information is provided exclusively for personal, non-commercial use, and may not be used for any purpose other than to identify prospective properties consumers may be interested in purchasing. Information is deemed reliable but not guaranteed.
IDX information is provided exclusively for personal, non-commercial use, and may not be used for any purpose other than to identify prospective properties consumers may be interested in purchasing. Information is deemed reliable but not guaranteed.
Nearby Homes
- 76 Farview Farm Rd
- 23 Goodsell Hill Rd
- 22 Woods Way Unit 22
- 0 Old Farm Rd
- 32 Beeholm Rd
- 9 Maple St
- 6 Maple St
- 219 Redding Rd
- 20 Georgetown Rd
- 2 Kramer Ln
- 78 Portland Ave
- 100 Georgetown Rd
- 0 Mountain Rd
- 5 New Street Extension
- 96 Georgetown Rd
- 11 Ledgewood Rd
- 45 Wayside Ln
- 14 Parsons Ln
- 0 Old Mill Rd
- 4 Ledgewood Rd